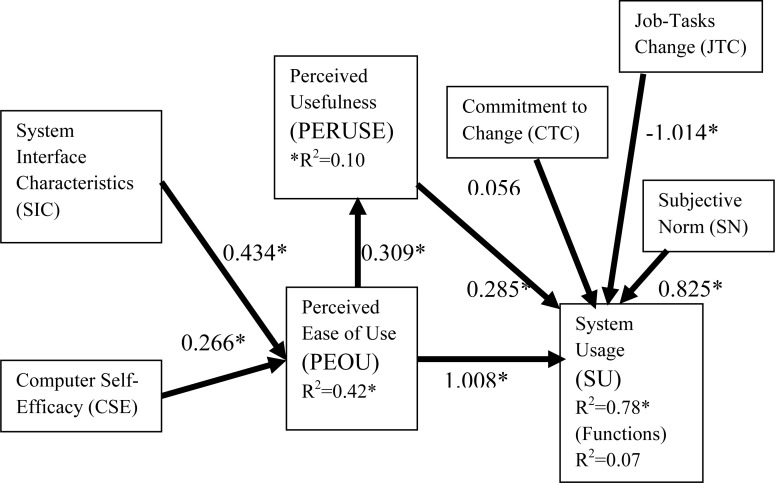
Figure 2.
Graphical Presentation of Study Findings - Model Estimates and R2 Shown.
Parameter estimates from Model 1, 2 and 3 are shown on this diagram and are preceded by *, indicating their significance level (*p<0.10 (significant).
R2 is also shown and it is the proportion of variance in the dependent variable explained by the independent variables.
Note: The parameter estimates showing the direct effects on system use are from Model 3 (functions system used for – dependent variable).

