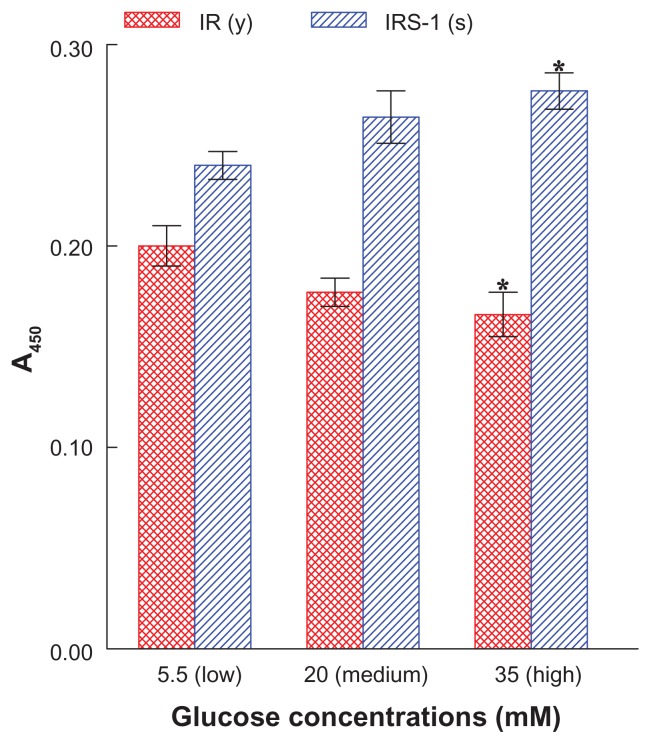
Figure 1.
Effects of varying concentrations of Glc on the phosphorylation levels of IR(y) or IRS-1(s) in L6 myotubes.
Notes: After cells were exposed to low (as control, 5.5 mM), medium (20 mM), or high (35 mM) concentrations of Glc for 24 hours, the phosphorylation status of IR(y) or IRS-1(s) was analyzed and expressed by the absorbance readings at 450 nm. All data are mean ± SD from three separate experiments (*P < 0.05 versus respective control).
Abbreviations: A450, absorbance at 450 nm; Glc, glucose; IR, insulin receptor; IRS-1, IR substrate 1; (s), serine residue; SD, standard deviation; (y), tyrosine residue.

