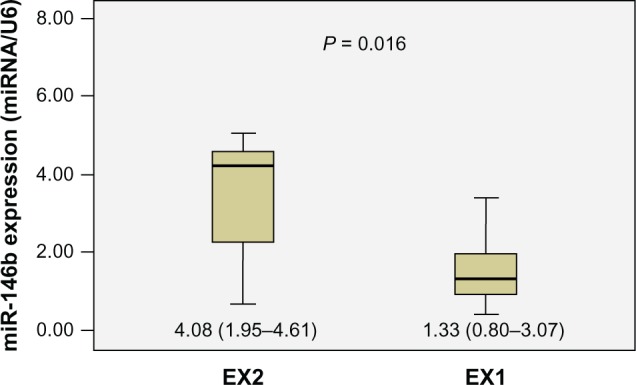
Figure 3.

Diagrammatic representation of Mann–Whitney U test results, showing that the relative expression of miR-146b in the EX2 group (n = 11, median = 4.08, interquartile range 1.95–4.61) was significantly higher than that in the EX1 group (n = 14, median = 1.33, interquartile range 0.80–3.07) (P = 0.016).
Abbreviations: EX1, minimal extrathyroid invasion; EX2, massive extrathyroid invasion.
