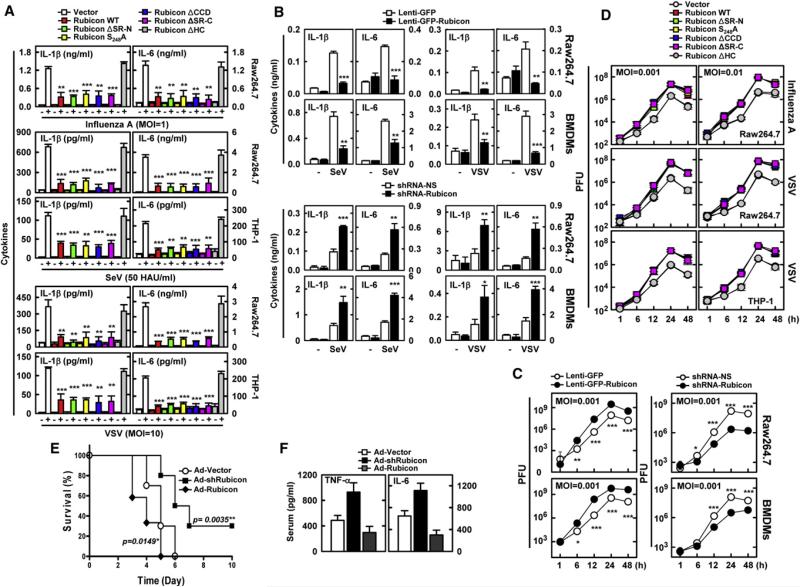
Figure 6. Negative Effect of Rubicon on Host Antiviral Activity.
(A) Decrease of virus infection-induced cytokine production by Rubicon. Raw264.7 cells containing vector, Rubicon WT, or its mutants were infected with influenza A virus PR8, SeV, or GFP-VSV for cytokine ELISA. Additional data of THP-1 cells are shown in Figures S6C.
(B) Rubicon expression levels affect virus infection-induced cytokine production. Raw264.7 cells and BMDMs infected with lenti-GFP or lenti-GFP-Rubicon for Rubicon expression or infected with lentivirus-shRNA-NS or lentivirus-shRNA-Rubicon for Rubicon depeletion were infected with SeV or VSV for cytokine ELISA. Additional data are shown in Figures S6D and S6E.
(C) Rubicon expression levels affect intracellular virus-killing activity. Raw246.7 or BMDMs infected with lenti-GFP or lenti-GFP-Rubicon for Rubicon expression or infected with lentivirus-shRNA-NS or lentivirus-shRNA-Rubicon for Rubicon depeletion were infected with VSV for the indicated times, the culture medium was harvested, and virus loads were determined by plaque assay on Vero cells. Additional data are shown in Figures S6F and S6G.
(D) Rubicon expression suppresses intracellular virus-killing activity in a CARD9-binding-dependent manner. Raw246.7 cells expressing vector, Rubicon WT, or its mutants were infected with influenza A virus PR8 strain or VSV at various mois for the indicated times, and virus loads were determined by plaque assay on MDCK or Vero cells, respectively. Additional data are shown in Figure S6H.
(E and F) Alteration of Rubicon gene expression affects mouse mortality after influenza A virus infection. At 48 hr postinjection with Ad-vector (1 × 10¹³ pfu/kg), AdshRubicon (1 × 10¹² pfu/kg), or Ad-Rubicon (1 × 10¹³ pfu/kg) twice i.v. via tail vein, mice were infected with influenza A virus PR8 strain (1 × 10⁵ PFU per mouse) and mortality was measured for n = 10 mice per group (E). (F) Serum cytokine levels of infected mice (n = 5 per group) were determined at 3 days p.i. with influenza A virus PR8 strain (5 × 10⁴ PFU). Additional data including body weight loss and lung virus loads of the infected mice are shown in Figures S6I and S6J. PFU, plaque-forming units. The data are the mean ± SD of values from three experiments. *p < 0.05; **p < 0.01; ***p < 0.001 compared with the control. See also Figure S6.

