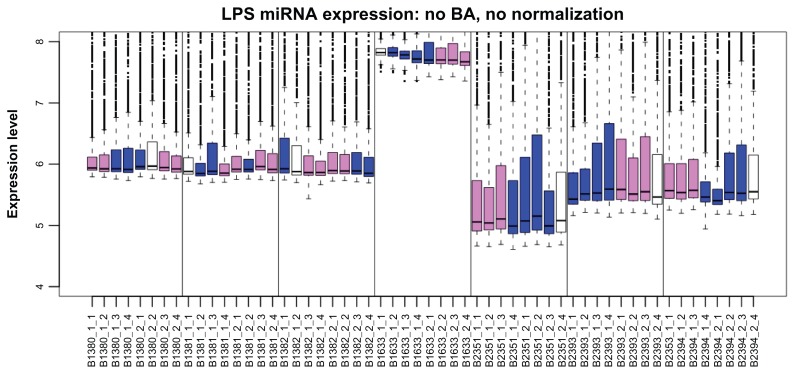
Figure 1.
Boxplot of the foreground intensity on the log2 scale for the Agilent arrays (n = 56) in the liposarcoma study.
Notes: Data at the probe level with no normalization are displayed with one box per array. The arrays are ordered by array slide, with vertical lines between slides. Colors indicate the sample type (white for normal adipose tissue, violet for WD, and blue for DD).
Abbreviations: LPS, liposarcoma; BA, background adjustment.

