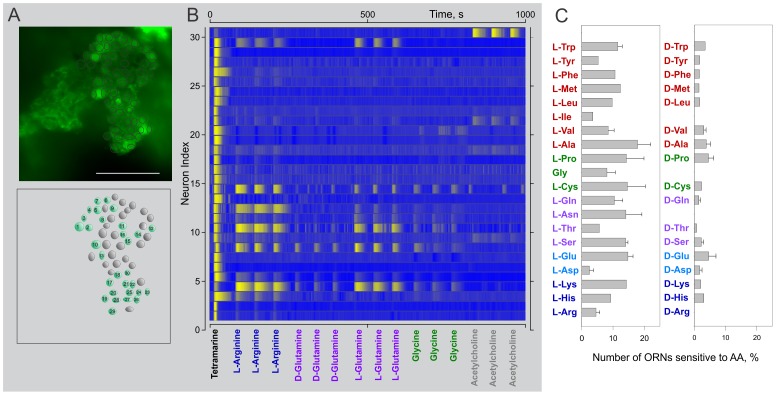
Figure 6. Single odorants specifically activate a restricted number of lobster ORNs.
ORN ensemble activity from single neuronal cluster (A) evoked by both complex odor mixture and single odorants (B). A – Map of individual cell regions analyzed. Position of every ORN region was carefully selected and corrected, if necessary, during the recording course to maximally avoid overlapping of optical signals. B – Fluorescence intensity traces from indexed ORN regions (A, bottom) were color coded using the intensity range characterizing individual ORN. Color gradient code applied to all data points changes from blue (minimum value) to yellow (maximum fluorescent intensity value). Each prospective odor, except TET, was applied 3 times. Stimulus pulse duration was 1s in all cases. Time between successive sweeps, 60 sec. Delay between successive trials, ∼120 s (not shown). Note, while complex odor mixture would activate majority of ORNs (first sweep), single odorants evoke calcium responses in a restricted number of ORNs. In some cases, ORNs are predominantly sensitive to single odorants (e.g. ORN30 demonstrates robust responses exclusively to acetylcholine). All stimuli were used at concentration 1 mM except an aqueous extract of TET (∼0.2 mg/ml). C – Incidence histogram of the effects of L- (left column) and D- amino acid isomers (right column). Bars represent a number of ORNs sensitive to a particular amino acid expressed as percentage of a number of TET activated ORNs. Overall 10.3+−1% of ORNs are sensitive to L-AAs while in average only 2.3+−0.3% responded to D- isomers. Amino acids are grouped and color coded based on their side chains properties. D-Isoleucine and D-Asparagine were not tested.

