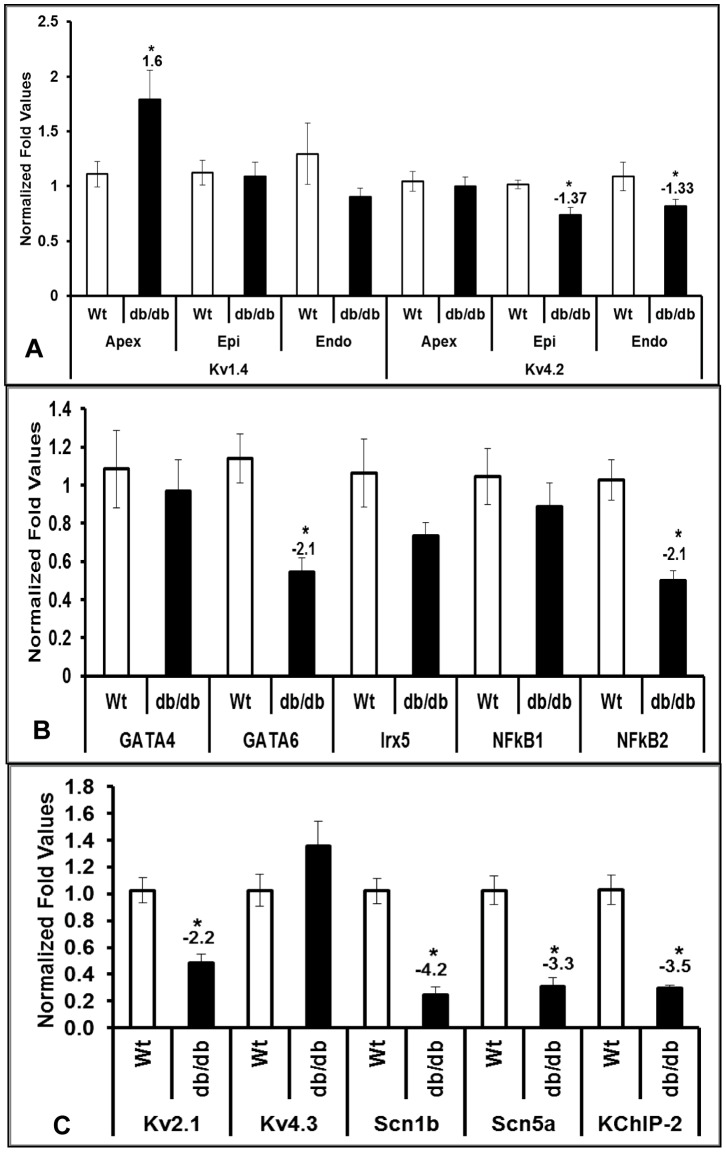
Figure 3. Differential expression of genes in left ventricle.
The qRT-PCR analysis of Kv4.2 and 1.4 in epicardium, endocardium and apex region (A), GATA4, GATA6, Irx5, NFkB (B), Kv2.1, Kv4.3, Scn1b, Scn5a, and KChIP2 (C) in epicardium of left ventricle (LV) from wild type (Wt) and diabetic (db/db) mouse hearts. Normalized fold values were expressed in bar diagrams are mean (±SEM) of n = 3 and * represents p≤0.05.

