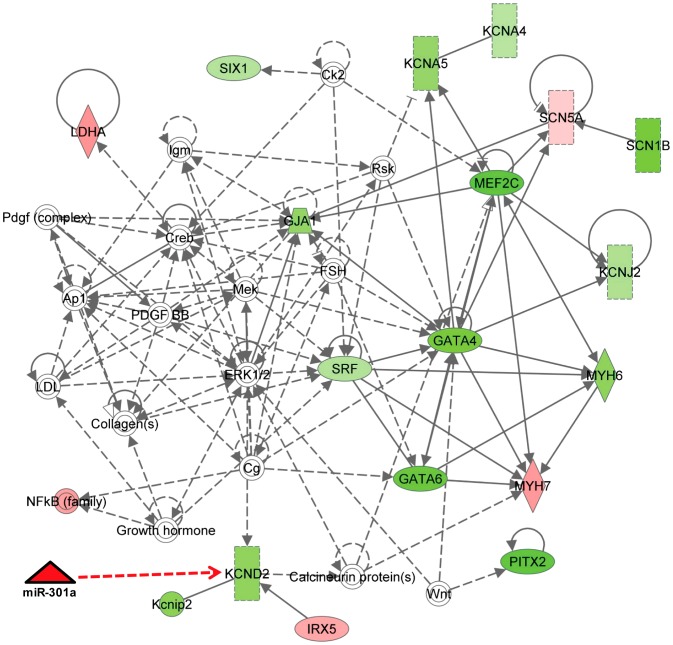
Figure 10. Cellular pathway affecting the cardiac arrhythmia, cardiovascular disease and tachycardia in RV of diabetic hearts.
The differentially regulated genes in qRT-PCR analysis in right ventricle of db/db hearts compared to their wild type controls were taken as input data and Ingenuity Pathway Analysis (IPA) software was used to build interactive network(s) based on the relations available from its library. Genes shown in green color were down-regulated and up-regulated genes were shown in red color, where intensity of color is proportional to the fold values. Dotted arrows represent indirect relations and solid lines represent direct relations between the genes. Genes that are present in the network but not present in the input data are shown without any color.

