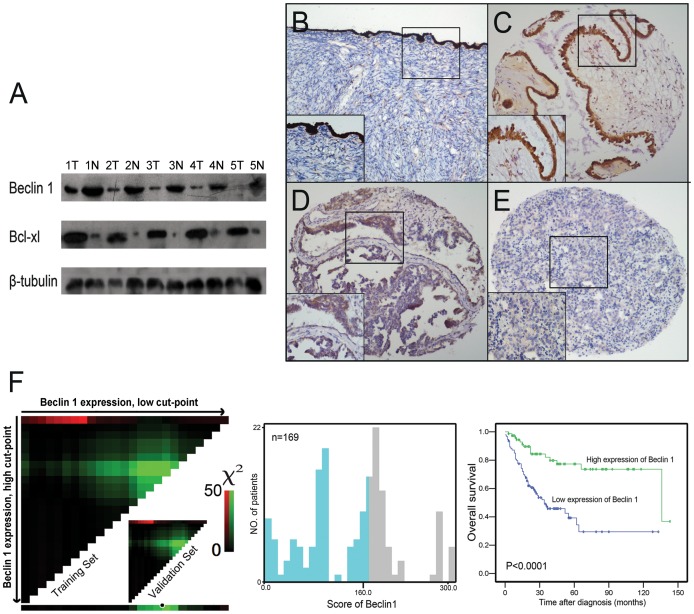
Figure 1. Beclin 1 and Bcl-xL expressions in ovarian tissues and X-tile plots of Beclin 1 expression in ovarian carcinomas.
(A) Western blotting analysis of Beclin 1 and Bcl-xL expressions in ovarian carcinoma tissues (T) and adjacent normal ovarian tissues (N). (B) High expression of Beclin 1 was observed in epithelia cells of normal ovary by immunohistochemistry. (C) Highly-expressed Beclin 1 was examined in a cystadenoma case 12. (D) An ovarian borderline tumor (Case 18) showed immunoreactivity of Beclin 1 mainly in cytoplasm. (E) Low expression of Beclin 1 was detected in an ovarian carcinoma case (Case 79). Representative sites in tissue microarray with low (×100) and high (inset, ×400) magnification were shown. (F) X-tile analysis was employed to determine the cutpoint for Beclin 1 expression, by equally dividing the total patients into training and validation subsets. X-tile plots of training sets were displayed in the left panels, with matched validation sets in the smaller inset. The plot showed the χ2 log-rank values generated when dividing the cohort into two populations. The cutpoint (H score = 160) highlighted by the black/white circle in the horizontal axis (left panel) was demonstrated on a histogram of the entire cohort (middle panel), and a Kaplan-Meier plot (right panel).

