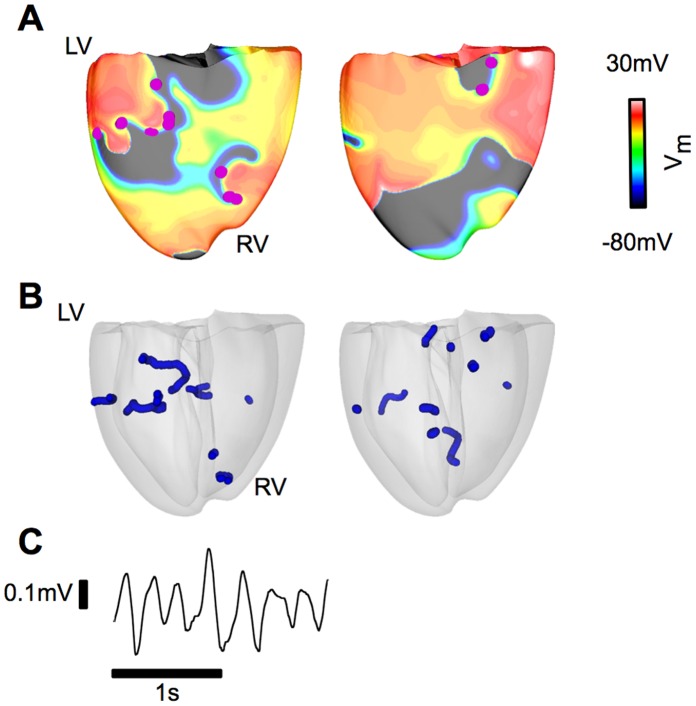
Figure 2. VF in the electromechanical model without SAC representation.
(A): Epicardial transmembrane potential distribution maps on the posterior wall from the simulation without SAC representation. Pink dots indicate the locations of the phase singularities. (B): Posterior semi-transparent view of the ventricles shows the filament distribution (blue). (C): Pseudo-ECG.

