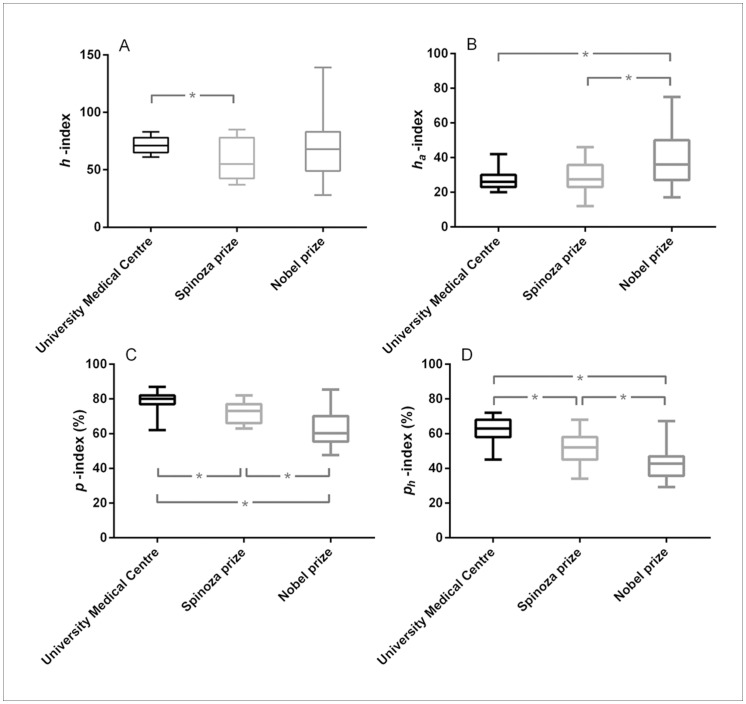
Figure 3. Comparison between University Medical Centre researchers (top 15 with highest h -index), Spinoza laureates and Nobel laureates in the biomedical field with respect to different citation metrics.
The horizontal lines within the boxes represent the median values, the edges of the boxes indicate the interquartile range, and the outer horizontal lines indicate the minimum and maximum values. Data are given for: A. h-index; B. profit adjusted h-index (ha-index); C. profit index (p-index); D. profit h-index (ph-index). * Denotes p-values smaller than 0.05. P-values were calculated using the Mann-Whitney U test and indicate differences in median values. Please refer to Table 3 for the statistical outcomes of the other comparisons.

