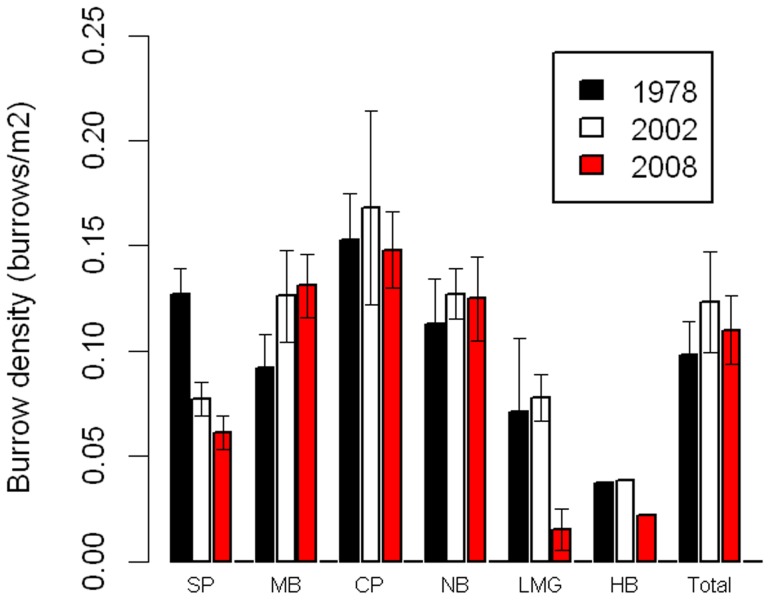
Figure 2. Burrow density changes.
Burrow density (burrows m−2) at each colony on Lord Howe Island in three years (error bars represent standard errors, as those are what was given in Priddel et al. 2006). (1978 = 1978/9; 2002 = 2002/3; 2008 = 2008/9; SP = Steven's Point; MB = Middle Beach; CP = Clear Place; NB = Ned's Beach; LMG = Little Muttonbird Ground; HB = Hunter Bay).

