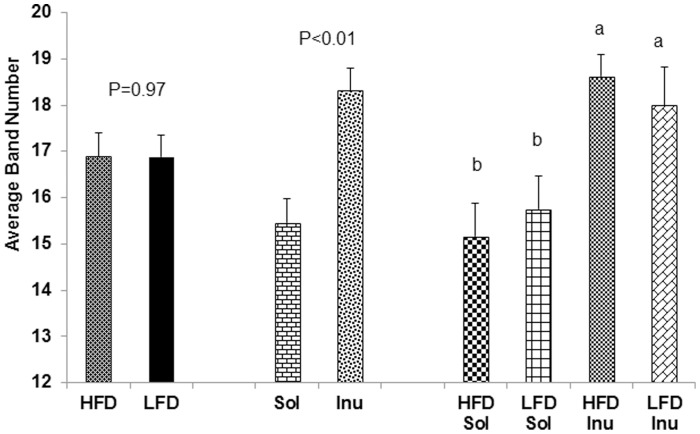
Figure 1. Band numbers from the PCR-DGGE profiles of cecal microbial communities.
Dietary fiber type and fat content affected band numbers of 16S rRNA gene PCR-DGGE profiles of cecal microbial communities. LFD, low fat diet-fed pigs; HFD, high fat diet-fed pigs; Inu, inulin diet-fed pigs; Sol, solka floc diet fed pigs. Bars represent least-squares means ± SE. Different letters on bars indicate significant difference (P<0.05).

