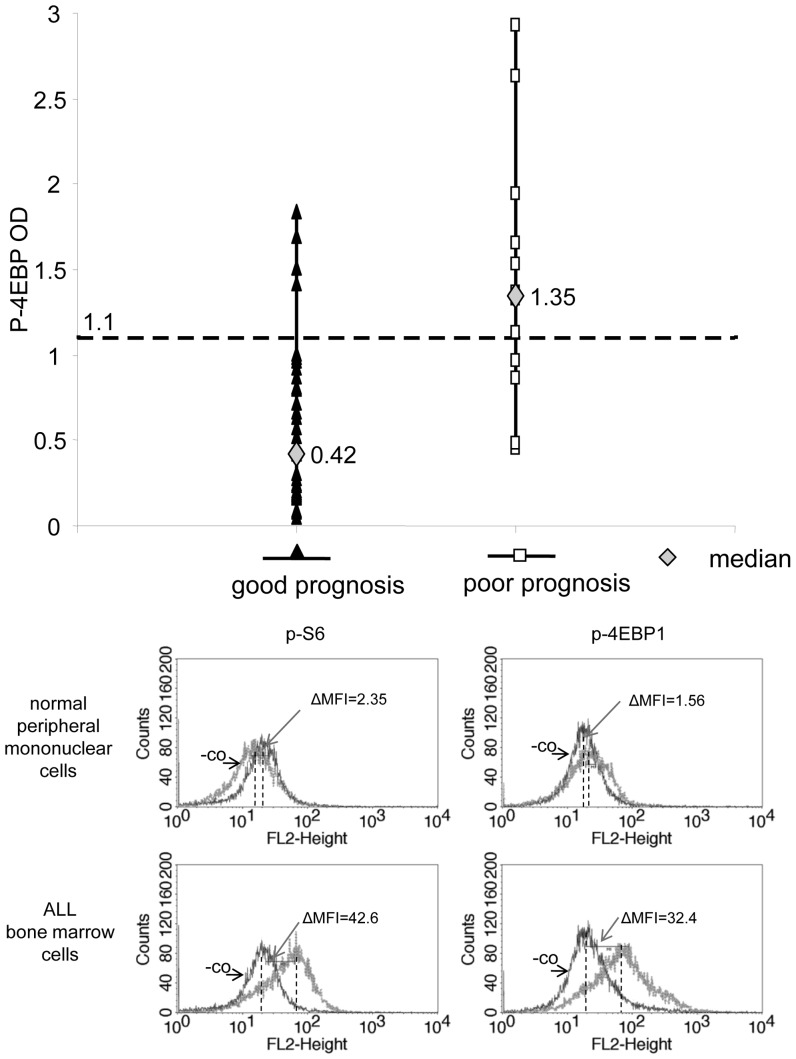
Figure 2. mTOR activity related p-4EBP1 expression in samples of ALL patients with different prognoses (ELISA) and detection of p-4EBP1 and p-S6 in ALL cells by flow cytometry.
(a) P-4EBP1 OD values in 49 ALL samples (n = 37 for patients with good prognosis; n = 12 for poor prognosis, criteria for prognostic groups are described in the Methods section). P-4EBP1 OD levels were significantly different between patients with good and poor prognosis (p<0.05). The cutoff value between p-4EBP1 OD values representing high and low mTOR activity was determined to be 1.1 by ROC curve analysis. (b) p-S6 and p-4EBP1 overexpression is confirmed by flow cytometry in ALL cells. Representative histograms for p-4EBP1 and p-S6 flow cytometric analysis in normal PMNC and in ALL samples. Expression was calculated as the difference between MFIs of p-4EBP1 or p-S6 stained (p-4EBP1 and p-S6, respectively) and parallel unstained controls (-co). Differences between MFIs (ΔMFI) was 2.35 (pS6) and 1.56 (p-4EBP1) for normal peripheral mononuclear cells. However, ΔMFI was 42.6 and 32.4 for p-S6 and p-4EBP1, respectively, in the representative ALL case shown here.

