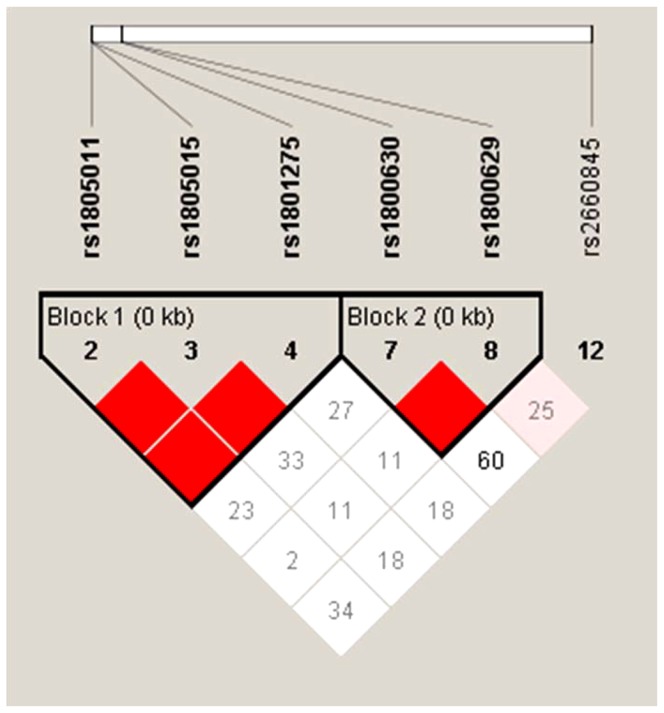
Figure 1. Linkage disequilibrium (LD) structure of the examined genetic loci of interest in the study population.
The haplotype blocks were generated by Haploview using the default algorithm [21]. Values in the boxes are D' measures, indicating extent of LD between two SNPs. Boxes without numbers have D' = 1.

