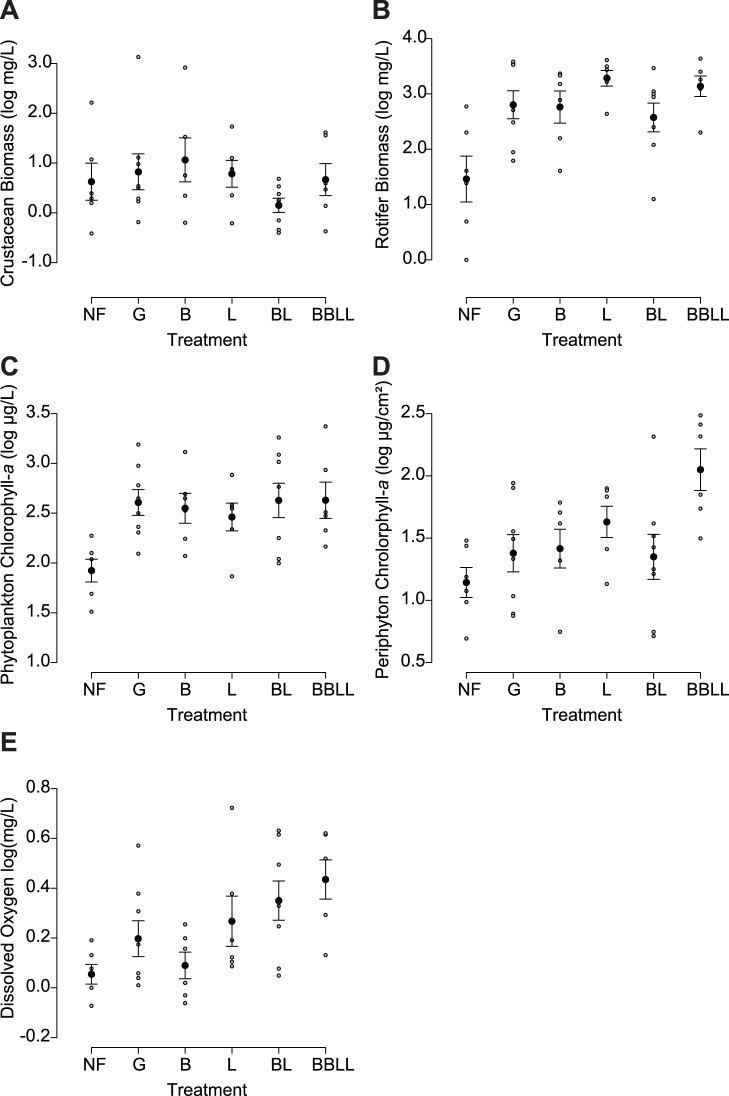
Figure 1. Zooplankton mass in grams per liter across different treatments for (A) crustaceans and (B) rotifers; primary producer abundance in terms of (C) concentration of periphyton and (D) phytoplankton chlorophyll-a concentration in milligrams per liter across treatments and total system net productivity (E) in terms of daily changes in dissolved oxygen concentration in milligrams per liter across treatments.
Bars represent standard error of the mean. Treatments correspond to NF = no fish, G = generalist ecotype, B = benthic ecotype, L = limnetic ecotype, BL = limnetic and benthic ecotype together, BBLL = double density of limnetic and benthic ecotype together.

