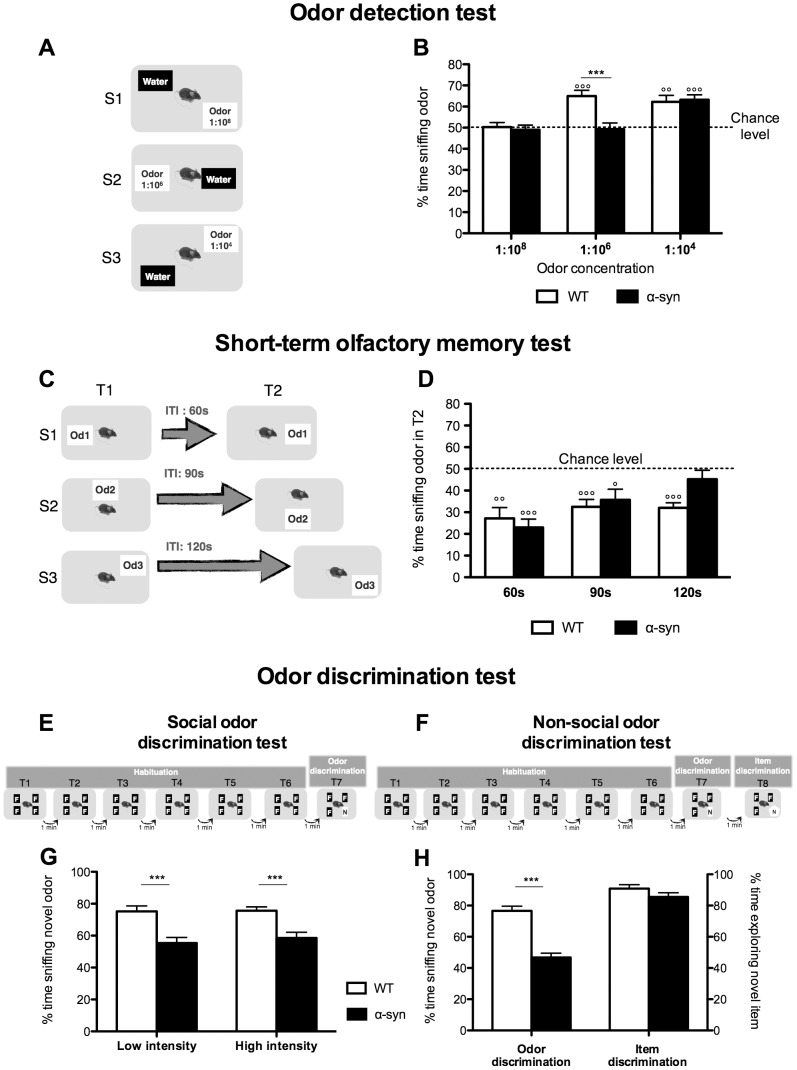
Figure 2. Olfactory deficits in the α-syn mouse model of PD.
A-B: Odor detection test. A. Description of the protocol composed of 3 sessions (S). In each 5-min session, mice were exposed to 2 cartridges, one filled with water, the other with increasing odor concentrations from 1∶108 to 1∶104. B. Percentage of time sniffing the odor for the different concentrations. WT mice start detecting the odor at the concentration 1∶106 when percentage of time sniffing the odor is significantly different from the chance level (50%, where mice spent same time sniffing water and odor cartridges) (°°°p<0.001, °°p<0.01, one-sample t-test). α-Syn mice can detect the odor only at 1∶104 (°°°p<0.001, one-sample t-test). At the concentration 1∶106, α-syn mice are significantly impaired compared to WT. N = 10 for each group aged 10–11 months. Statistics: One-sample t-test to compare each value to chance level (50%), (°°°p<0.001, °°p<0.01). Two-way RM ANOVA: odor concentration, p = 0.0001, F(2,36) = 11.96; genotype, p = 0.015, F(1,36) = 7.2; odor concentration×genotype, p = 0.0073, F(2,36) = 5.65; Bonferroni post-hoc (***p<0.001). C-D: Short-term olfactory memory test. C. Description of the protocol composed of 3 sessions (S). Each session consisted of two 5 min-trials (T) where mice are exposed to a novel odor separated by an increasing inter-trial time (ITI) from 60 s to 120 s. D. Percentage of time sniffing the odor during T2 compared to the total time spent sniffing during both trials. WT mice remember the odor during the 2nd exposure for the 3 ITI tested and their percentage of time sniffing the odor during T2 was significantly different from the chance level (50%, where mice spent same time sniffing the odor during T1 and T2) (°°p<0.01, °°°p<0.001, one-sample t-test). By contrast, short-term olfactory memory of α-syn mice was impaired from an ITI of 120 s (p>0.05, one-sample t-test). However, it was significantly different from chance level at 60 s and 90 s (°°°p<0.001 and °p<0.05 respectively, one-sample t-tests). N = 10 for each group aged 10–11 months. Statistics: One-sample t-test to compare each value to chance level (50%), (°°°p<0.001, °°p<0.01, °p<0.05). E-H: Odor discrimination test. E and G: Social odor discrimination test. E. Description of the protocol composed of 6 habituation trials where mice are exposed to a familiar odor (F, odor of the tested mouse); and one odor discrimination trial, where one familiar odor is replaced by a novel odor (N, another mouse's odor). This test was performed with low or high odor intensities (wood blocks impregnated with mouse's odor for 2 or 7 days respectively). Each trial lasted 2 min and was separated by 1 min. G. Percentage of time sniffing novel odor. For both low and high odor intensities, α-syn mice have impaired odor discrimination with the percentage of time sniffing the odor significantly lower than WT. N = 19–21 for each group aged 10–11 months. Statistics: Two-way RM ANOVA: odor intensity, p = 0.55, F(1,38) = 0.37; genotype, p<0.0001, F(1,38) = 27.1; odor intensity×genotype, p = 0.63, F(1,38) = 0.23; Bonferroni post-hoc (***p<0.001). F and H: Non-social odor discrimination test. F. Description of the protocol based on the same principle of the social odor discrimination test but using non-social odors (lemon and lime). In the 8th 2 min-trial, an item discrimination trial was added where the usual cartridge, with the novel odor (lime), was replaced by a novel item (a novel type of cartridge associated with the same novel odor, lime). H. Percentage of time sniffing the novel odor during the odor discrimination trial and percentage of time exploring the novel item in the item discrimination trial. α-syn mice had significantly impaired odor discrimination of the social odor. By contrast, the ability to discriminate the novel item was similar between WT and α-syn mice suggesting that the discrimination deficit is specific to olfaction. Statistics: unpaired t-test, non-social odor discrimination p<0.0001, N = 19–21 for each group aged 10–11 months; item discrimination p = 0.16, N = 10 for each group aged 10-11 months (***p<0.001).

