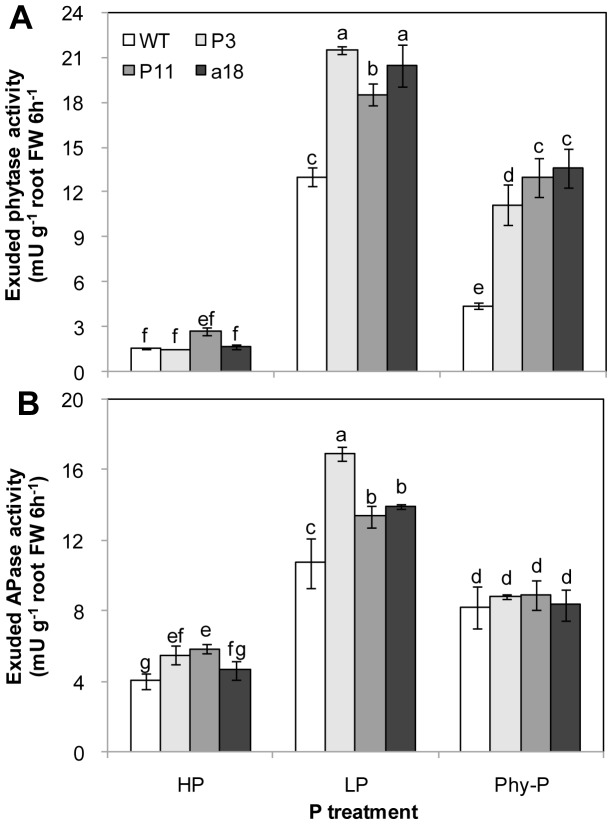
Figure 3. Phytase activity (A) and acid phosphatase activity (B) exuded from roots of transgenic lines expressing ex::phyA/appA and WT.
Plants were grown in different P treatment solutions. Each column is the mean of four replicates with SD. Different letters represent significant differences at the p<0.05 level.

