
Figure 8. β3 mutants of adducted residues.
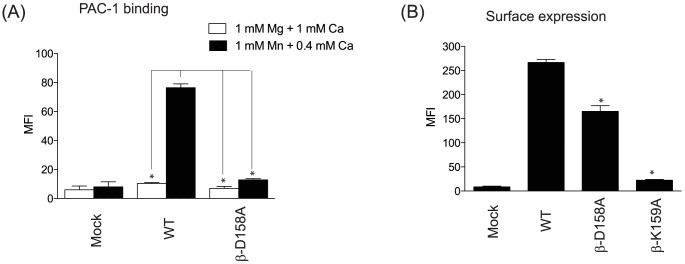
(A) PAC-1 binding to mock, αIIbβ3 wild type or mutant in 1 mM Mg2+/Ca2+ or 1 mM Mn2+/0.4 mM Ca2+. MFI; mean fluorescence intensity. One-way analysis of variance with Tukey post hoc analysis was performed to compare different groups (excluding mock group). * denotes p<0.05 versus wild type, 1 mM Mn2+/0.4 mM Ca2+ group. (B) Surface expression of mock, αIIbβ3 wild-type or mutants probed by AP3 is shown. Data is shown as mean +/− S.D. of three independent experiments. One-way analysis of variance with Tukey post hoc analysis was performed (excluding mock group). * denotes p<0.05 versus wild type.