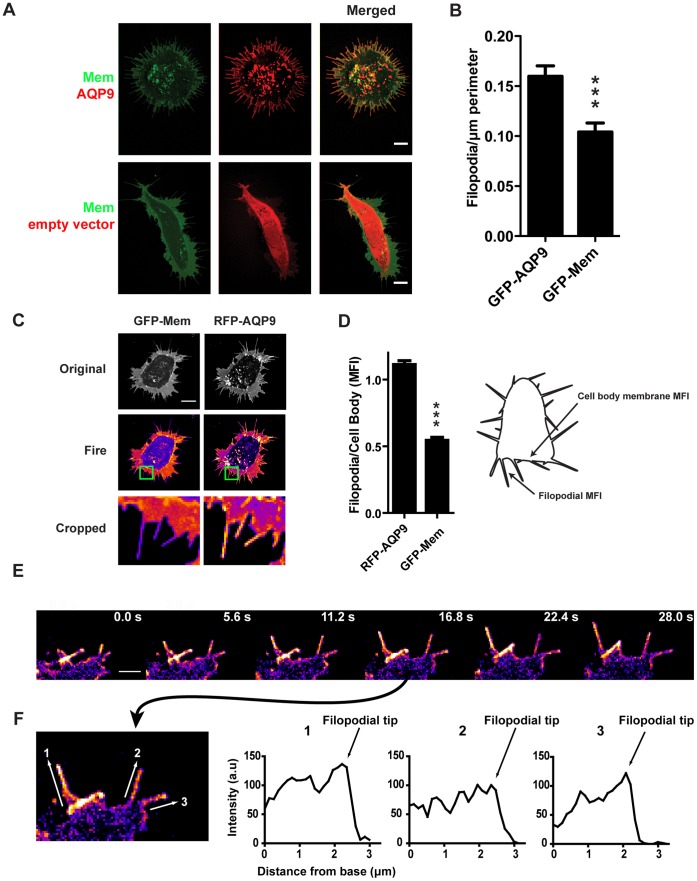
Figure 1. Characterization of AQP9-induced filopodia.
(A) Representative confocal images of HEK-293 cells transfected with tagRFP-AQP9 or empty vector together with GFP-Mem to label the membrane. Intensities have been adjusted linearly to visualize the relative expression and localization of both fluorophores. Scalebar 10 µm. (B) Quantification of peripheral filopodia in HEK-293 cells transfected with GFP-AQP9 or GFP-Mem. The data is presented as mean number of filopodia/µm perimeter(±SEM; n = 34–43 cells/group). (C) Representative confocal images of HEK-293 cells transfected with tagRFP-AQP9 and GFP-Mem. Images are pseudo-colored in fire scale to visualize the differences between the two vectors in the filopodia. The intensities have been adjusted linearly to visualize the relative distribution of both fluorophores. The lower panel represents enlargement of the green box. Scalebar 10 µm. (D) Ratiometric measurements of mean fluorescence intensity (MFI) in the filopodial membrane divided by MFI in the cell body membrane in HEK-293 cells transfected with both tagRFP-AQP9 and GFP-Mem. Measurement areas are illustrated in the schematic image. The data is presented as mean (± SEM, n = 51 filopodia/group). (E) Montage of a representative confocal time-lapse of a HEK-293 cell overexpressing GFP-AQP9 pseudo-colored in fire scale to visualize AQP9 localization in growing filopodia. The linear intensity has been adjusted to visualize differences in fluorescent intensity. Scalebar 2 µm. (F, left panel) An enlarged image from (E) showing the points of measurements for the profile plots presented in the right panel. (F, right panel) Intensity profile plots of filopodia during growth to visualize AQP9 accumulation in filopodial tips.

