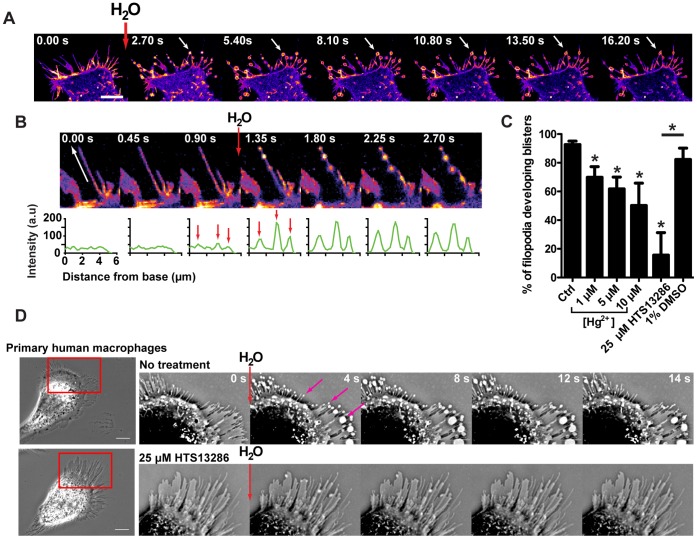
Figure 3. Addition of H2O to the medium causes filopodial bleb-like protrusions.
(A) Confocal time-lapse montage of a HEK-293 cell stably overexpressing GFP-AQP9. During acquisition, 20 µl of H2O was added to the medium (2 ml) with a pipette directed towards the cell, yielding a rapid but transient reduction in local osmolarity. The images are pseudo-colored in fire scale to visualize variations in fluorescence intensity. White arrows are pointing towards a representative bleb-like protrusions formed during image acquisition. Scale bar 10 µm. (B, upper panel) An enlarged image of a single filopodium during acquisition, before and after the addition of H2O. The white arrow shows the direction and length of measurement presented in the lower panel. The images are linearly adjusted and pseudo-colored in fire scale to visualize variations in fluorescent intensity. (B, lower panel) Intensity profile plots measured along the filopodia as shown by the white arrow. The red arrows are pointing towards peaks in fluorescent intensity before and after the addition of H2O. (C) Quantification of the percentage of filopodia that developed filopodial bleb-like protrusions subsequent to the addition of 20 µl of H2O after pre-treatment with AQP9-inhibitors. HEK-293 cells overexpressing GFP-AQP9 were pretreated with 1, 5 and 10 µM Hg2+ or with 25 µM of HTS13286. Control cells represents untreated HEK-293 cell overexpressing GFP-AQP9. Data is presented as mean (±SEM, n = 4–7 experiements/group). (D, left panel) Phase contrast images of primary human macrophages. The cell in the lower panel is treated with 25 µM of the novel AQP9 inhibitor HTS13286. (D, right panel) Cropped and inverted time lapse montage of the cells displayed in the left panel. During image acquisition 20 µl of H2O was added to the medium (2 ml). Magenta arrows are pointing towards filopodial bleb-like protrusions. Scale bar 10 µm.

