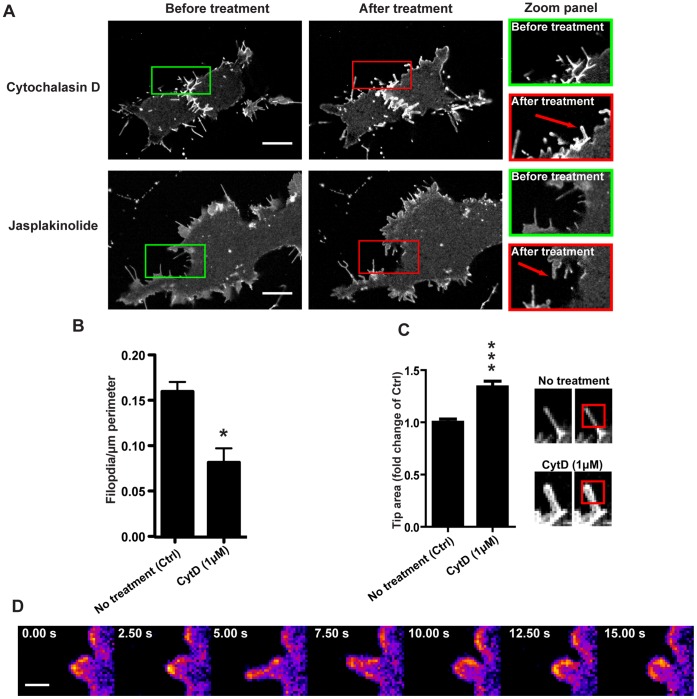
Figure 5. Disruption of actin dynamics inhibits the formation of new filopodia.
(A) Representative confocal images of HEK-293 cells stably overexpressing GFP-AQP9 before and 15 min after treatment with 1 µM Cyt D or 500 nM Jasplakinolide. The red arrows point towards distended filopodia. Scalebar 10 µm. (B) Quantification of peripheral filopodia before, and 10–15 min after treatment with 1 µM Cyt D. The data is presented as mean (±SEM, n = 5–43 cells/group). (C, left panel) Quantification of the relative filopodial tip area of GFP-AQP9 expressing cells before (Ctrl), and 15 min after the addition of 1 µM Cytochalsin D. The filopodial tips are defined by the fluorescent area occupied in a 2×2 µm ROI of the filopodial tips. The data is presented as mean (±SEM) of fold change compared to untreated cells (Ctrl; n = 13–22 filopodia/group).(C, right panel) Representative examples of a filopodia before and after treatment with Cyt D. The red box illustrates the area of measurement for the data presented in the left panel. (D) A confocal time-lapse montage of GFP-AQP9 fluorescence, pseudo-colored in fire scale, in HEK-293 cells 10 min after treatment with 10 µM Cytochalsin D. The images illustrate a bleb-like protrusion that recoils back towards the cell body after treatment with actin dynamics inhibitors. The linear intensity is adjusted to visualize differences in fluorescence intensity. Scalebar 1 µm.

