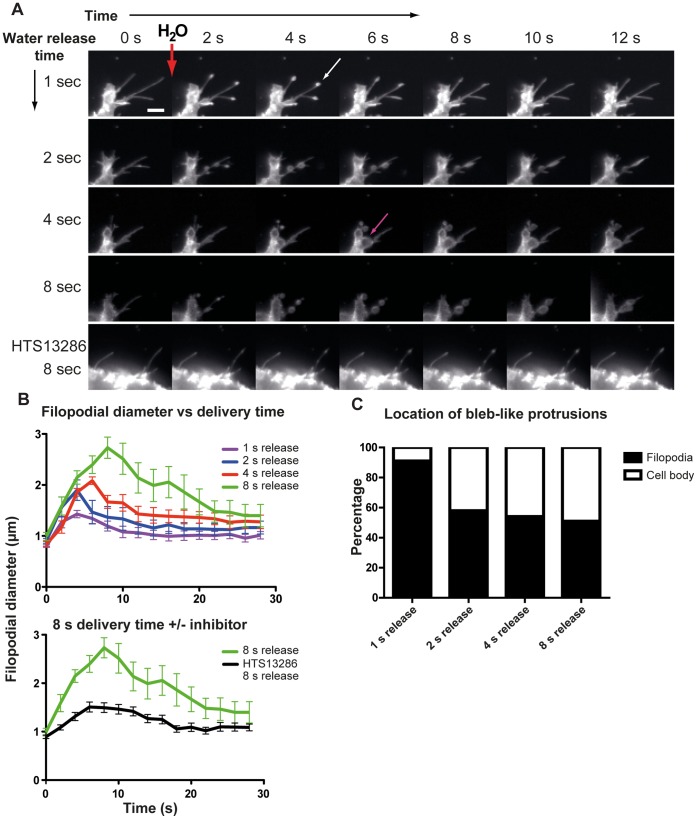
Figure 6. Size and location of H2O-induced bleb like protrusions.
(A) Time lapse montage of the formation of filopodial bleb-like protrusions. H2O was delivered with a micropipette in close proximity to the cell. The pressure (4000hPa) was applied to the micropipette for 1, 2, 4 or 8 s to the same cell. The white arrow is pointing toward a filopodial bleb-like protrusion. Magenta arrow is pointing toward a bleb-like protrusion originating from the cell body. (A, lower panel) Following an 8 s localized water release in close vicinity of a cell that was pre-treated with 25 µM HTS13286 no bleb-like formations were observed. Scale bar 5 µm. (B) Quantification of the filopodial diameter at the site of the bleb-like protrusion. Time 0 equals the image before localized H2O release. The lower graph shows the mean diameter for 8 s water release to cells untreated (green line), or treated with 25 µM of HTS13286 (black line).The data is displayed as mean±SEM, n = 8–18 filopodia/water release period. (C) Quantification of mean percentage of bleb-like protrusions originating from filopodia or the cell body after 1, 2, 4 or 8 s injection of micropipette-delivered H2O (n = 3 experiments).

