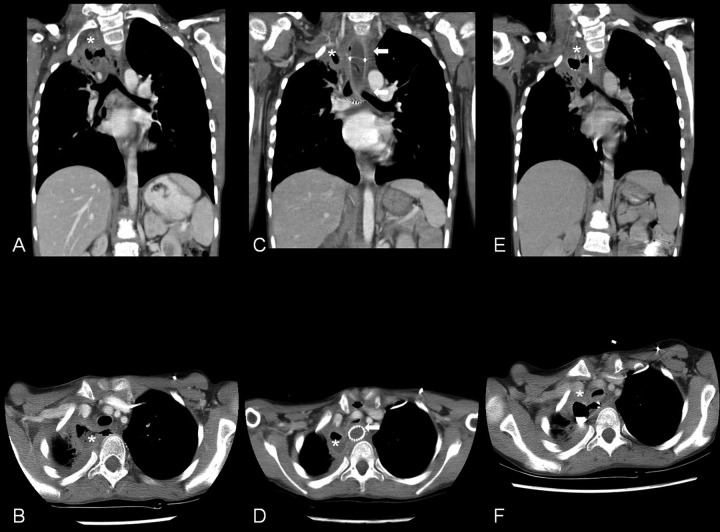
Figure 2.
Sequence of computed tomography (CT) scans following completion of chemo- and radiotherapy. Coronal view (A) of the first CT scan following completion of therapy showed a fluid collection in the right upper chest (*); axial view (B) showed a fistula (arrow head) extending from the esophagus to the fluid collection (*). Coronal view (C) of the CT scan following placement of an esophageal stent (arrow) showed good placement; axial view (D) showed occlusion of the fistula but severe compression of the trachea (arrow head). The fluid filled cavity is seen in both views (*). Coronal view (E) of the CT scan following palliative chemotherapy and nasogastric feeds showed persistence of the fistula and fluid filled cavity (*); axial view (F) showed persistence of the fistula (arrow head) and fluid filled cavity (*).

