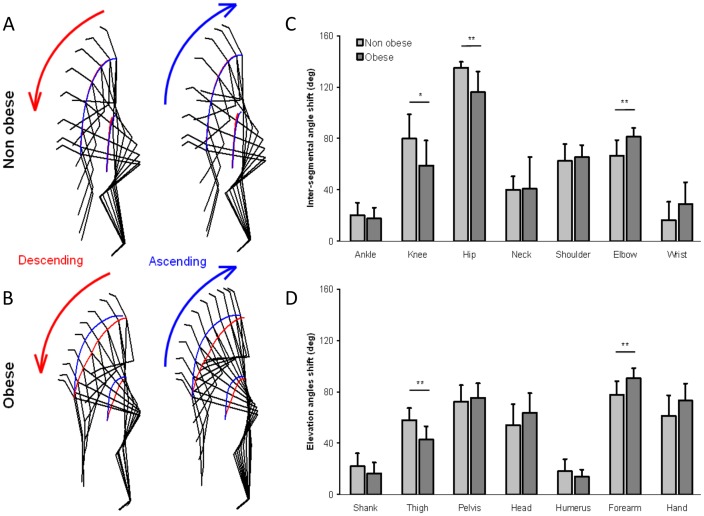
Figure 4. Kinogram representation of the descending and ascending movements executed at a natural speed for one non obese and one obese participant, representative of their respective groups.
The CoM and shoulder pathway are shown in red for the descending movement and blue for the ascending movement (a–b). Mean angle range of motion of the joint and mean elevation angle between the start and the end of the descending movement for the two non obese and obese groups (c–d).

