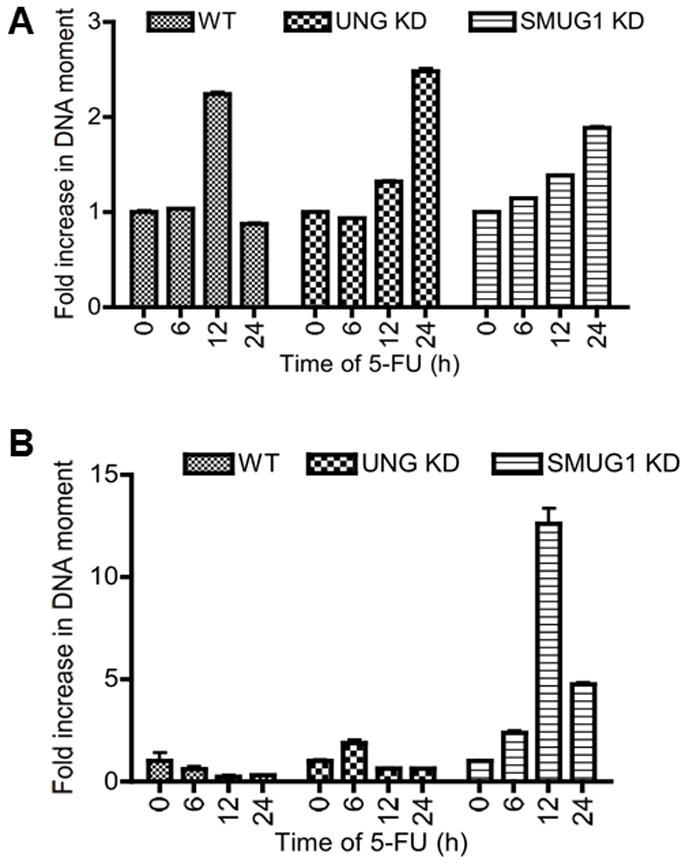
Figure 6.

DNA damage after 5-FU treatment as measured by the comet assay in the parental (WT), LN428/UNG-KD and LN428/SMUG1-KD lines. A) Alkaline electrophoresis. B) Neutral electrophoresis. Cells were treated with 50 μM 5-FU for the times indicated and processed as described in Materials and Methods. The y-axis represents fold increase in DNA moment compared to untreated cells (0 h time point). The data represents an average of three independent experiments and 100 cells measured per sample for each experiment. The error bars represent standard error of the mean.
