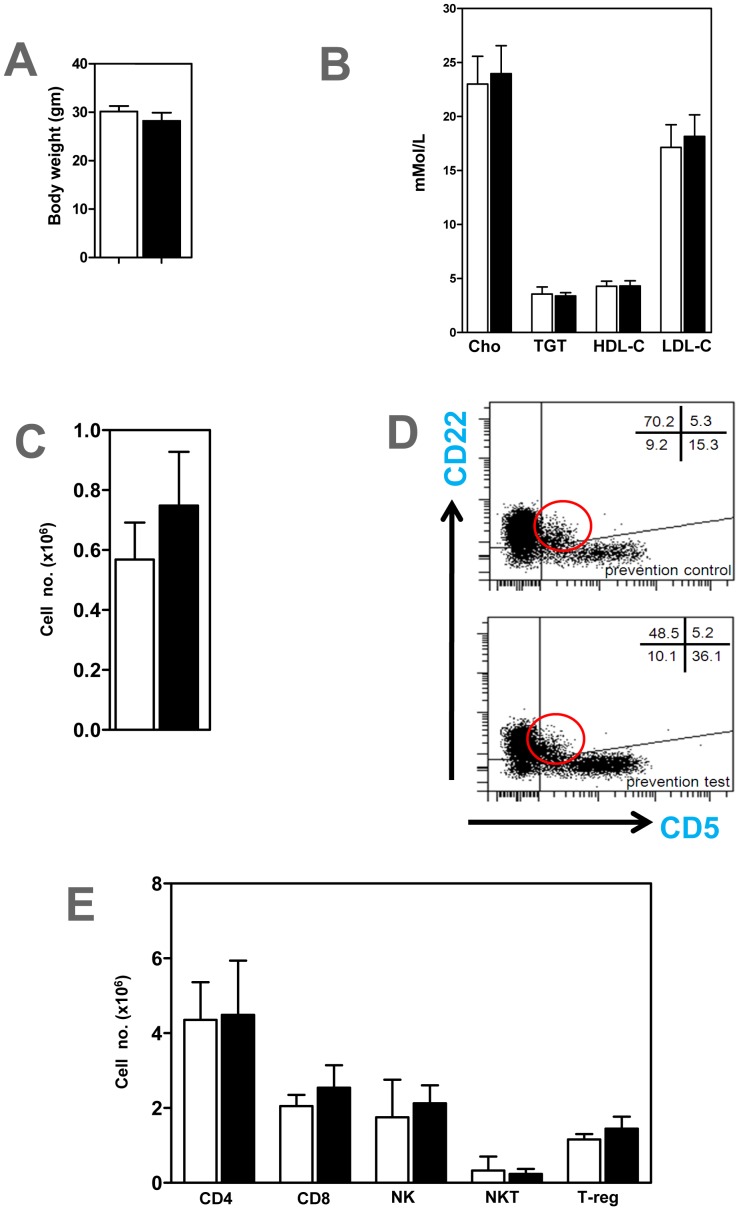
Figure 2. Body weight, plasma lipids, B1a and other lymphocytes unchanged in ApoE−/− mice treated with anti-BAFFR antibody.
A) Body weights, (B) Plasma lipids and (C) Peritoneal CD22+CD5+ B1a cells. (D) Peritoneal CD22+, CD5+ B1a B cells identified by FACS analysis. Red circle represents CD22+ CD5+ B1a cells (E) CD4+, CD8+, NK1.1+ (NK), NK1.1+ TCRβ+ (NKT) and CD4+ CD25+ foxp3+ regulatory T cells (T-reg) in spleens. n = 7–9 mice per each group □ control IgG treated mice; ▪ BAFFR-antibody treated mice.

