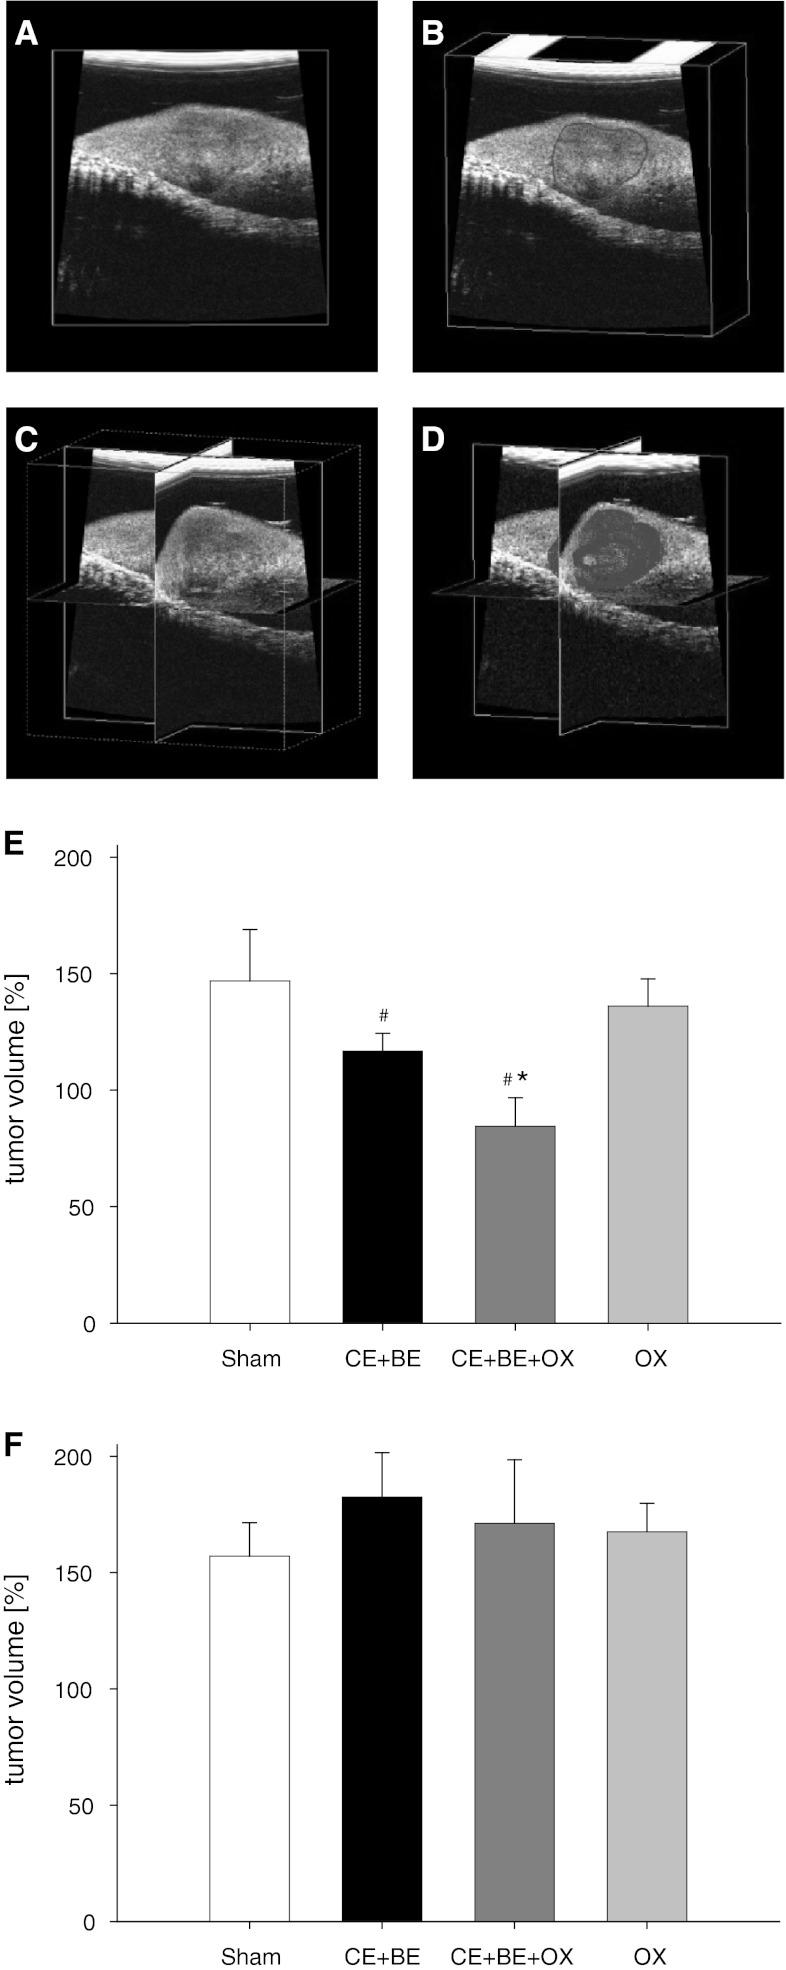
Fig. 1.
Panels a–d display the different phases of the three dimensional ultrasound imaging of the tumor (a Ultrasound image of the tumor bearing left liver lobe. b Off-line outlining of the tumor (red line), c Three dimensional cube, d Three dimensional cube with polygonal image of the tumor). The Tumor volume was measured on day 13 in percent of the volume measured on day 10 after HAI (e) and sCHT (f) of saline (sham), cetuximab plus bevacizumab (CE + BE) and oxaliplatin (OX) or the combination of all three drugs (CE + BE + OX). Data are given as mean ± SEM; *p < 0.05 versus sham; # p < 0.05 versus corresponding sCHT

