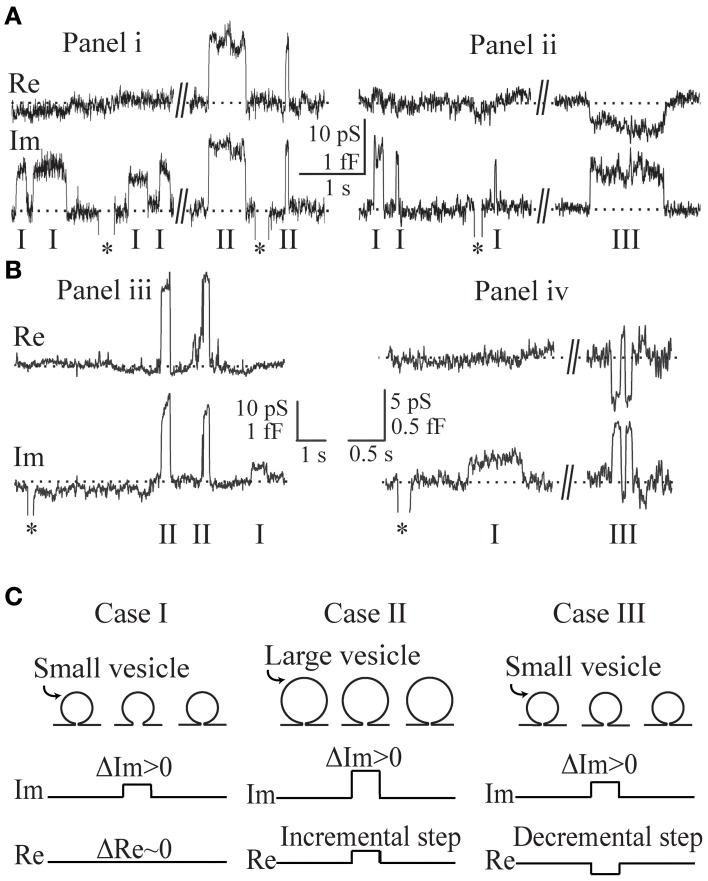
Figure 2.
Representative admittance measurements recorded in lactotrophs (Ai,ii) and astrocytes (Biii,iv) revealing a zero projection (case I), an incremental projection (case II), and a decremental projection (case III), on the Re part of the admittance signal. The asterisks in these recordings indicate calibration pulses. The recordings in (Ai,ii) and (Biii,iv) are recorded in the same patch of a lactotroph and an astrocyte, respectively. By incorporating the estimated ΔIm and ΔRe into the Equation (2), the corresponding vesicle capacitance amplitudes are determined for each event from the admittance records. For the recording in lactotrophs (Ai,ii), the vesicle capacitance of case I, case II, and case III, is 0.9 fF, 4.0 fF, and 1.2 fF, and for the astrocytes (Biii,iv), it is 0.3 fF, 1.6 fF, and 0.6 fF, respectively. Note the larger vesicle capacitance of case II when compared to case I. A schematic representation of the three cases as pre-fused vesicles with an initial narrow fusion-pore (C).

