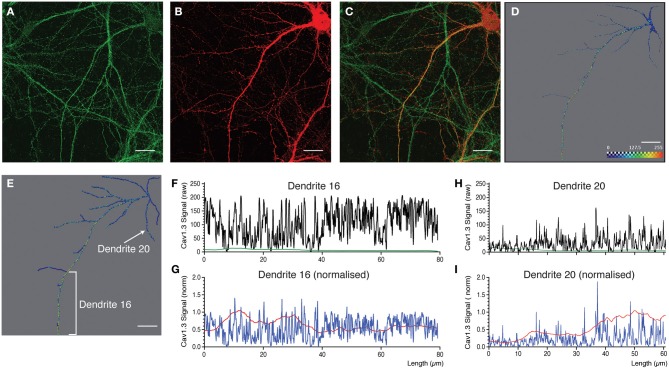
Figure 6.
Quantitative analysis and 3D profiling of endogenous Cav1.3 signal in cultured neocortical neurons. (A,B) Image stacks corresponding to endogenous Cav1.3 signal (A) and morphological label (mCherry expression) (B). (C) Overlay of images in (A and B). Images are z-projections derived from maximum signal intensity across 24 focal planes. (D,E) Amira images showing reconstructed dendritic skeleton overlaid with 3D ion channel profile derived from point fluorescence values calculated along the dendrite skeleton. (D) Morphological skeleton with dendritic dimensions representing the radius of the true dendrite structure. (E) Filament map. (F,G,H,I) Fluorescent intensity plots for two selected dendrites (indicated in panel E). Data is presented as the point fluorescent value and mean fluorescent value calculated at each point. (F,H) Raw data. (G,I) Data normalized to fluorescent intensity data obtained from applying the same analysis to the morphological label. Scale bar, 20 μm.

