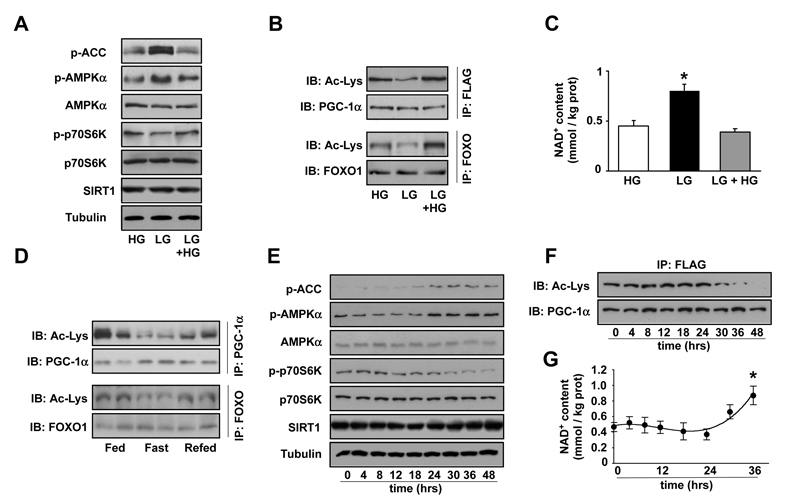
Figure 1. Glucose restriction increases PGC-1α-dependent gene expression.
(A-C) C2C12 myotubes were infected with adenoviruses encoding FLAG-HA-PGC-1α. Then, cells were left for 48hrs in medium containing either 25mM glucose (HG) or 5mM glucose (LG). A third group was treated by adding 25mM glucose medium for 6hrs after 48hrs in LG (LG + 6hrs HG). (A) Total protein was obtained and 100μg were used for Western blot analysis to test the markers indicated. (B) 500μg of total protein extracts were used for immunoprecipitation (IP) against FLAG antibody or against FOXO to determine the acetylation levels of PGC-1α or FOXO1, respectively. (C) Acidic lysates were obtained for measurement of NAD+ levels. Data are presented as mean±S.E. from 6 different experiments. * Indicates statistical difference vs. HG group. (D) 300μg of nuclear extracts from gastrocnemius muscle from fed, fasted or re-fed C57BL/6J mice were used for IP against PGC-1α or FOXO1 to measure acetylation. (E-G) After infection with adenoviruses encoding FLAG-HA-PGC-1α C2C12 myotubes were left in 5mM glucose medium and samples were obtained at the times indicated. (E) 100μg of total protein extracts were used for Western analysis to test the markers indicated. (F) 500μg of total protein extracts were used for immunoprecipitation to detect the acetylation levels of PGC-1α (G) Acidic lysates were obtained for measurement of NAD+ levels. Data are presented as mean±S.E. from 5 different experiments. * indicates statistical difference vs. t=0. All images are representative of 3-6 independent experiments.

