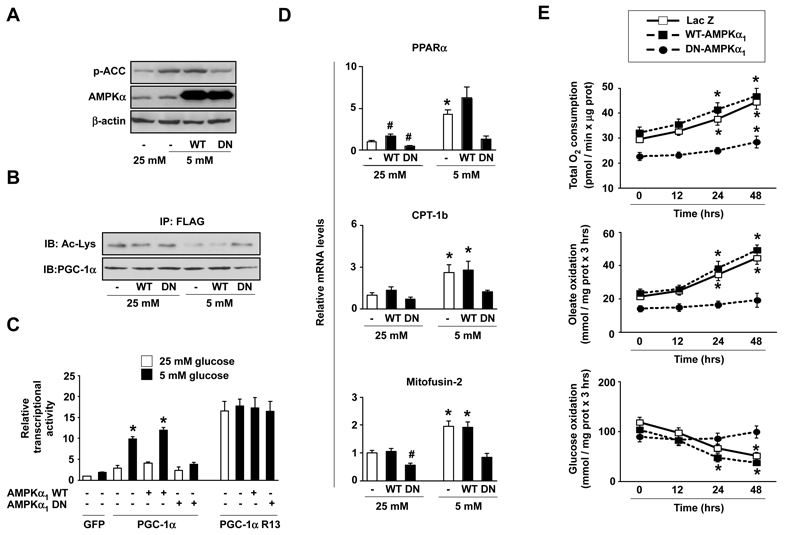
Figure 2. Disruption of AMPK activity renders PGC-1α activity and metabolic adaptations unresponsive to glucose restriction.
(A) C2C12 myotubes were infected with adenovirus encoding FLAG-HA-PGC-1α and either LacZ, a wild-type (WT) or a dominant negative (DN) form of AMPKα1. After infection cells were left for 48hrs in 25 or 5mM glucose medium. 100μg of total extracts were used for Western analysis. (B) As in (A), but 500 μg from total extracts were used for immunoprecipitation against FLAG to test PGC-1α acetylation levels. (C) C2C12 myoblasts were transfected with lacZ and either an empty vector (not shown) or a luciferase reporter construct linked to the mouse PGC-1α promoter. Simultaneously, cells were infected with adenovirus encoding for GFP (−), FLAG-HA-PGC-1α, FLAG-HA-PGC-1α R13, WT-AMPKα1 or DN-AMPKα1 as indicated. 36hrs later, cells were incubated for 48hrs in medium containing either 25 or 5mM glucose and luciferase activity was measured. A representative assay of 4 independent experiments is shown. Values are expressed as mean±SE. * indicates statistical difference vs. corresponding 25mM glucose group. (D) Similar to (A), but total mRNA was obtained for qRT-PCR analysis. Relative mRNA levels are shown as mean±SE from 4 experiments. * indicates statistical difference vs. corresponding 25mM glucose group. # indicates statistical difference vs. lacZ-infected 25mM group. (E) C2C12 myotubes were infected as in (A). Then, cells were left in 25 or 5mM glucose medium. At the indicated time points, O2 consumption, oleate and glucose oxidation rates were measured. Results are shown as mean±SE from 12, 6 and 4 independent experiments, respectively. * indicates statistical difference vs. time=0hrs.

