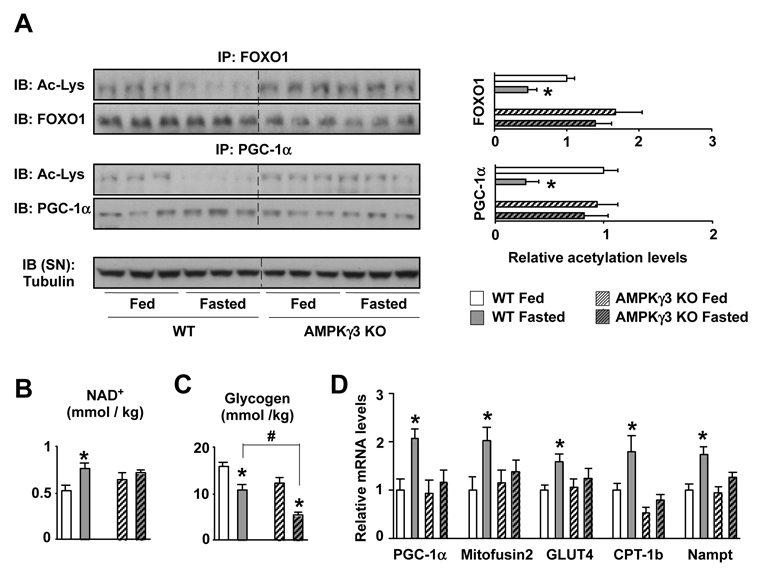
Figure 3. Impaired PGC-1α deacetylation and transcriptional response to fasting in AMPKγ3 KOs.
Wild type and AMPKγ3 KO mice in fed or fasted (20hrs) state were sacrificed and muscles were extracted and frozen (A) 2mg of total protein extracts from EDL muscles were used to immunoprecipitate FOXO1 and PGC-1α and check their acetylation. Relative quantifications of FOXO1 and PGC-1α acetylation levels are shown on the right as mean±SE of 6 muscles/group. (B) Acidic extracts from 50mg of gastrocnemius muscle were used to measure NAD+ content. Results are shown as mean±S.E. from 6 muscles measured in duplicate. (C) 20mg of quadriceps muscle were used to measure glycogen content. Results are shown as mean±S.E. from 5 muscles. # indicates statistical difference between the groups indicated (D) Total mRNA was extracted from quadriceps muscles and used for qPCR analysis. Results are shown as mean±SE from 10 muscles/group. Through the figure, * indicates statistical difference vs. respective fed group.

