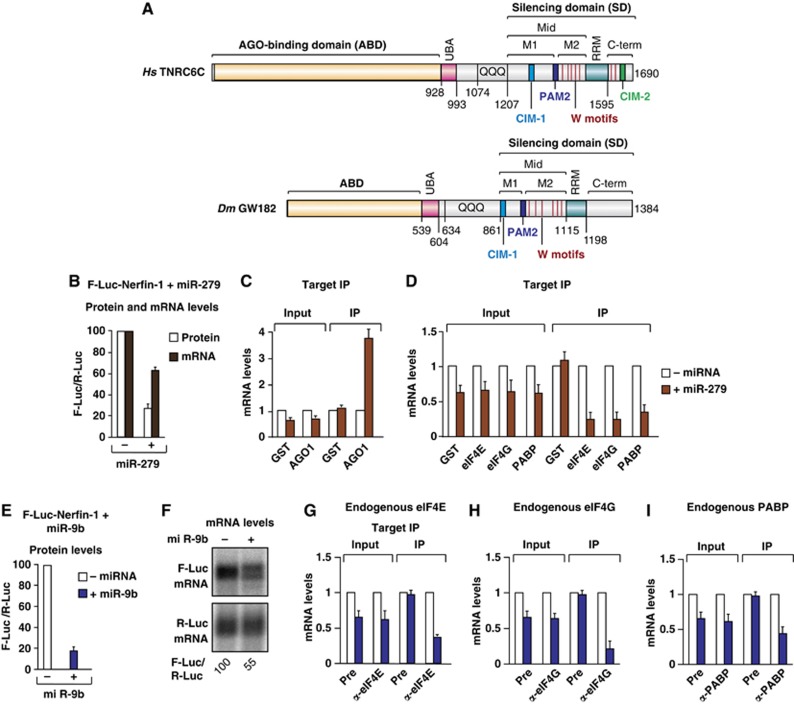
Figure 1.
The association of Dm eIF4E, eIF4G and PABP with silenced miRNA targets. (A) The domain organization of human TNRC6C and Dm GW182. ABD, AGO-binding domain; UBA, ubiquitin associated-like domain; QQQ, region rich in glutamine; Mid, middle region containing the PAM2 motif, which divides the Mid region into the M1 and M2 regions; RRM, RNA recognition motif; C-term, C-terminal region. The positions of the CIM-1 and CIM-2 motifs are indicated. Vertical red lines indicate the positions of tryptophans in the M2 and C-term regions that contribute to NOT1 binding. Amino-acid positions at domain boundaries are indicated below the protein outlines. (B–D) S2 cells were transfected with a mixture of three plasmids: one expressing an F-Luc-Nerfin-1 reporter, another expressing the miR-279 primary transcript or the corresponding empty vector (–), and a third expressing Renilla luciferase (R-Luc). The transfection mixtures contained plasmids expressing the indicated HA-tagged proteins. (B) Firefly luciferase activity (white bars) and mRNA levels (black bars) were normalized to those of the Renilla luciferase and set at 100 in the absence of miR-279 (–). (C, D) HA-tagged proteins were immunoprecipitated using anti-HA antibodies. HA–GST served as a negative control. The levels of F-Luc-Nerfin-1 mRNA (normalized to R-Luc mRNA) in the inputs and IPs were analysed by RT–qPCR. For each HA-tagged protein, the normalized values of F-Luc-Nerfin-1 mRNA were set at 1 in the absence of miR-279 (white bars). (E–I) S2 cells were transfected with a mixture of three plasmids as described above except that miR-9b was used instead of miR-279. (E) Firefly luciferase activity was normalized to that of the Renilla luciferase and set at 100 in the absence of miR-9b. (F) Northern blot of representative RNA samples. Numbers below the panel indicate F-Luc mRNA levels normalized to the R-Luc transfection control and set at 100 in the absence of miR-9b. (G–I) Endogenous eIF4E, eIF4G and PABP were immunoprecipitated using polyclonal antibodies. The corresponding preimmune (Pre) sera served as negative controls. The association of F-Luc-Nerfin-1 mRNA with the endogenous proteins was analysed using RT–qPCR as described above. In all figures shown in this manuscript, bars represent mean values and error bars standard deviations from three independent experiments.
Source data for this figure is available on the online supplementary information page.

