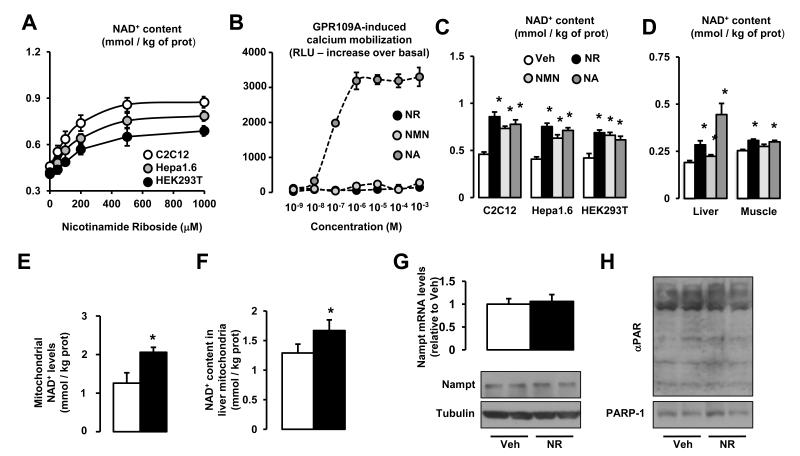
Figure 1. Nicotinamide Riboside supplementation increases NAD+ content and sirtuin activity in cultured mammalian cells.
(A) C2C12 myotubes, Hepa1.6 and HEK293T cells were treated with nicotinamide riboside (NR) for 24 hrs and acidic extracts were obtained to measure total NAD+ intracellular content. (B) GPR109A-expressing Chem-4 cells were loaded with 3 μM Fura-2 acetoxymethyl ester derivative (Fura-2/AM) for 30 min at 37 °C. Then, cells were washed with Hank’s balanced salt solution and calcium flux in response to nicotinic acid (NA; as positive control), NR and nicotinamide mononucleotide (NMN) at the concentrations indicated was determined as indicated in methods. (C) C2C12 myotubes, Hepa1.6 and HEK293T cells were treated with either PBS (as Vehicle) or 0.5 mM of NR, NMN or NA for 24 hrs. Then total NAD+ intracellular content was determined as in (A). (D) C57Bl/6J mice were fed with chow containing vehicle (water) or either NR, NMN or NA at 400 mg/kg/day (n=8 mice per group). After one week, NAD+ content was determined in liver and quadriceps muscle. (E) HEK293T cells were treated with NR (0.5 mM, black bars) or vehicle (white bars) for 4 hrs. Then, cells were harvested and mitochondria were isolated for NAD+ measurement. (F) C57Bl/6J mice were fed with chow containing vehicle (water) or NR at 400 mg/kg/day (n=8 mice per group). After one week, mitochondria were isolated from their livers to measure NAD+ content. (G) HEK293T cells were treated with either PBS (as Vehicle) or 0.5 mM of NR for 24 hrs. Then mRNA and protein was extracted to measure Nampt levels by RT-qPCR and western blot, respectively. (H) HEK293T cells were treated with either PBS (as Vehicle) or 0.5 mM of NR for 24 hrs. Then protein homogenates were obtained to test global PARylation and PARP-1 levels. Throughout the figure, all values are presented as mean +/− SD. * indicates statistical significant difference vs. respective vehicle group at P < 0.05. Unless otherwise stated, the vehicle groups are represented by white bars, and NR groups are represented by black bars.

