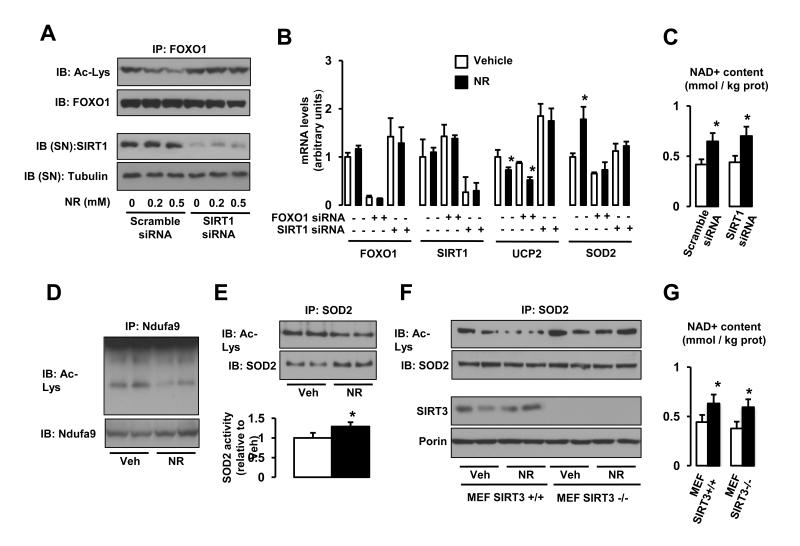
Figure 2. Nicotinamide Riboside supplementation increases sirtuin activity in cultured mammalian cells.
(A) HEK293T cells were transfected with a pool of either scramble siRNAs or SIRT1 siRNAs. After 24 hrs, cells were treated with vehicle (PBS) or NR at the concentrations indicated, and, after an additional 24 hrs, total protein extracts were obtained. FOXO1 acetylation was tested after FOXO1 immunoprecipitation (IP) from 500 μg of protein, while tubulin and SIRT1 levels were evaluated in the supernatant of the IP. (B) HEK293T cells were transfected with a pool of either scramble siRNAs, FOXO1 siRNAs or SIRT1 siRNAs. After 24 hrs, cells were treated with NR (0.5 mM; black bars) or vehicle (PBS; white bars) for additional 24 hrs. Then total mRNA was extracted and the mRNA expression levels of the markers indicated was evaluated by qRT-PCR. (C) HEK293T cells were transfected with a pool of either scramble siRNAs, FOXO1 siRNAs or SIRT1 siRNAs. After 24 hrs, cells were treated with NR (0.5 mM; black bars) or vehicle (PBS; white bars) for additional 24 hrs. Then acidic extracts were obtained to measure intracellular NAD+ levels. (D-E) HEK293T cells were treated with NR (0.5 mM) or vehicle (PBS) for 24 hrs and total protein extracts were obtained to measure (D) Ndufa9 or (E) SOD2 acetylation after IP. The extracts were also used to measure SOD2 activity (E, bottom panel). (F-G). SIRT3+/+ and SIRT3−/− mouse embryonic fibroblasts (MEFs) were treated with NR (0.5 mM) or vehicle (PBS) for 24 hrs and either (F) total extracts to test SOD2 acetylation were obtained or (G) acidic extracts were used to measure intracellular NAD+ content. Throughout the figure, all values are presented as mean +/− SD. * indicates statistical significant difference vs. respective vehicle group at P < 0.05. Unless otherwise stated, the vehicle groups are represented by white bars, and NR groups are represented by black bars. This figure is complemented by Fig.S1

