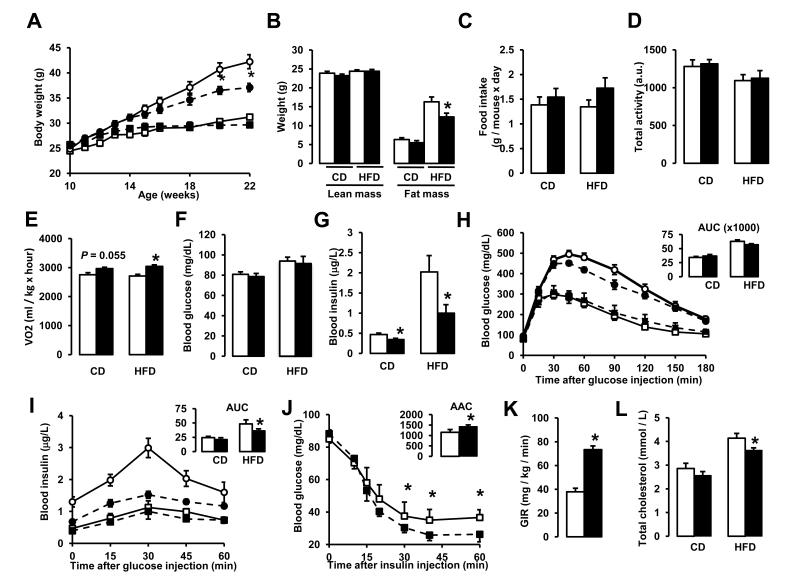
Figure 3. NR supplementation prevents diet-induced obesity by enhancing energy expenditure and reduces cholesterol levels.
10-week-old C57Bl/6J mice were fed with either chow (CD) or high fat diet (HFD) mixed with either water (as vehicle) or NR (400 mg/kg/day) (n=10 mice per group). (A) Body weight evolution was monitored during 12 weeks. (B) Body composition was evaluated after 8 weeks of diet through Echo-MRI. (C-E) Food intake, activity and VO2 were evaluated using indirect calorimetry. (F-G) Blood glucose and insulin levels were measured in animals fed with their respective diets for 16 weeks after a 6 hr fast. (H-I) After 10 weeks on their respective diets (CD = squares; HFD = circles) an intraperitoneal glucose tolerance test was performed in mice that were fasted overnight. At the indicated times blood samples were obtained to evaluate either (H) glucose or (I) insulin levels. Areas under the curve are shown at the top-right of the respective panels. (J) Insulin tolerance tests were performed on either CD or CD-NR mice (4 weeks of treatment). At the indicated times, blood samples were obtained to evaluate blood glucose levels. The area above the curve is shown at the top-right of the panel. (K) Hyperinsulinemic-euglycemic clamps were performed on either CD or CD-NR mice (4 weeks of treatment). Glucose infusion rates (GIR) were calculated after the test. (L) Serum levels of total cholesterol were measured in animals fed with their respective diets for 16 weeks, after a 6 hr fast. Throughout the figure, white represent the vehicle group and black represent the NR-supplemented mice. All values are presented as mean +/− SD. * indicates statistical significant difference vs. respective vehicle treated group. This figure is complemented by Fig.S2

