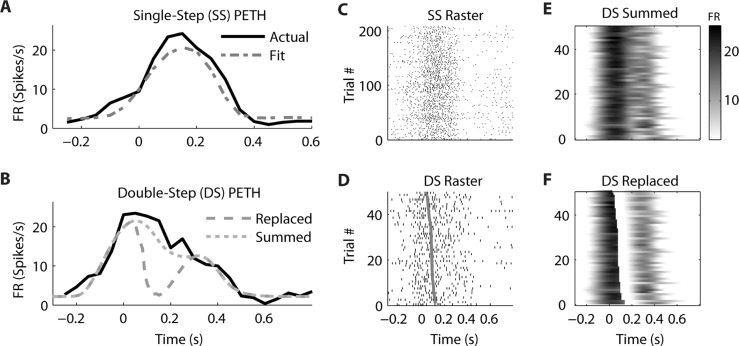
FIGURE 5.
A neuron from ventral premotor cortex is better fit by the “Summed” hypothesis. (A) During single-step (SS) trials, the observed peri-event time histogram (PETH, black) is well fit by a model assuming linear encoding of velocity and speed (gray dot dash). Zero time refers to the time of target appearance. (B) During double-step (DS) trials, the observed PETH (black) is well fit by the “Summed” prediction (gray dotted) but not the “Replaced” prediction (gray dashed). Zero time refers to the time of the target jump. (C) The single-trial spike time rasters for the SS trials. (D) The single-trial spike time rasters for the DS trials, arranged by the predicted replacement time (gray). (E) The DS single-trial prediction of the “Summed” hypothesis, displayed as a heat map. (F) The DS single-trial prediction of the “Replaced” hypothesis.

