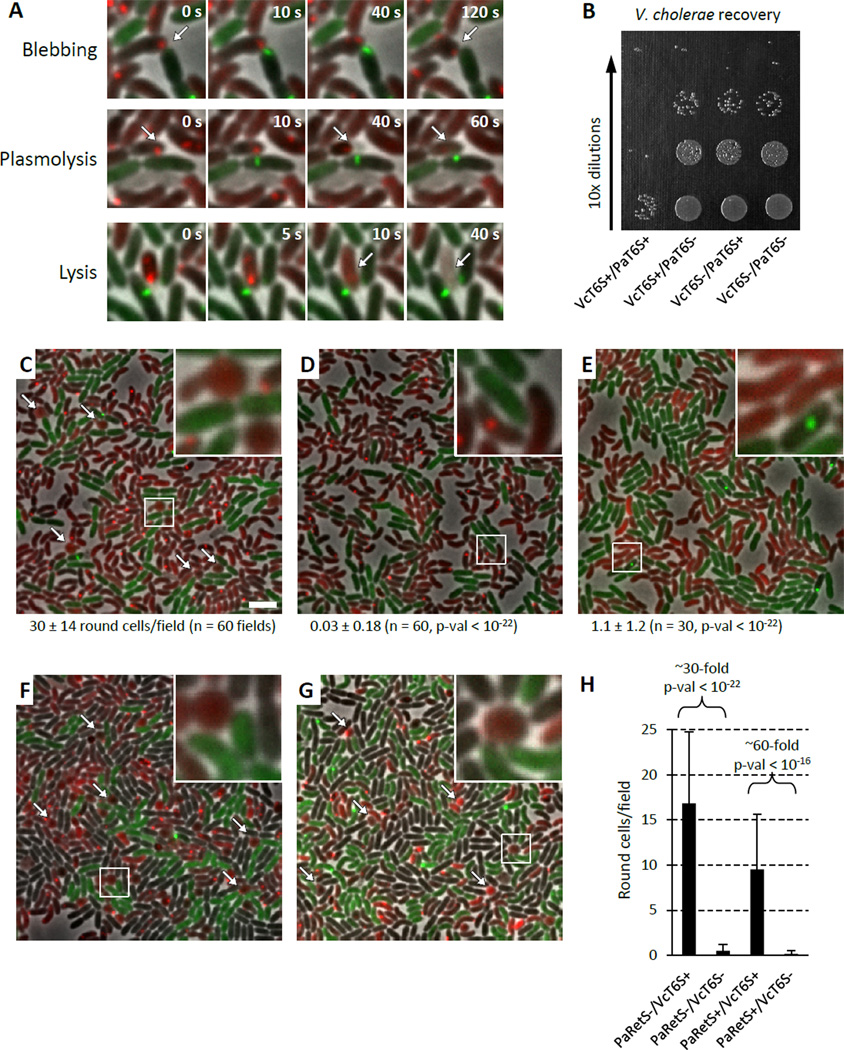
Figure 1. P. aeruginosa T6SS preferentially targets T6SS positive V. cholerae.
See also Movie S1, S2, Table S1, S2. VcT6S+ indicates V. cholerae clpV-mCherry2, VcT6S− indicates V. cholerae ΔvipA clpV-mCherry2, PaT6S+ indicates P. aeruginosa ΔretS clpV1-gfp, PaT6S− indicates P. aeruginosa ΔretS ΔvipA1 clpV1-gfp. PaRetS− indicates P. aeruginosa ΔretS, PaRetS+ indicates P. aeruginosa. (A) Examples of morphological changes of V. cholerae seen in mixtures of P. aeruginosa ΔretS clpV1-gfp (T6SS+, green) and V. cholerae clpV-mCherry2 (T6SS+, red). 4.5x4.5 µm fields are shown. (B) Example of a dilution series used to enumerate V. cholerae recovery from a competition with P. aeruginosa. (C−G) 30x30 µm representative field of cells with a 4x magnified 3x3 µm inset (marked by box). Bar in C is 3 µm and applies to C–G. Arrows point to examples of round V. cholerae cells. (C−E) Average number of round V. cholerae cells per 30x30 µm field (± standard deviation) is shown for each mixture (n fields were analyzed), p-val compared to mixture in C. (C) P. aeruginosa ΔretS clpV1-gfp (T6SS+, green) mixed with V. cholerae clpV-mCherry2 (T6SS+, red), (D) P. aeruginosa ΔretS ΔvipA1 clpV1-gfp (T6SS−, green) mixed with V. cholerae clpV-mCherry2 (T6SS+, red), (E) P. aeruginosa ΔretS clpV1-gfp (T6SS+, green) mixed with V. cholerae ΔvipA clpV-mCherry2 (T6SS−, red). (F, G) V. cholerae clpV-mCherry2 (T6SS+, red), and V. cholerae ΔvipA clpV-gfp (T6SS−, green) strains were mixed at equal ratios with (F) P. aeruginosa ΔretS (T6SS+, unlabeled), (G) P. aeruginosa (T6SS+, unlabeled). (H) Quantification of number of round V. cholerae cells detected per 30x30 µm field (n = 60) for mixtures shown in F and G.

