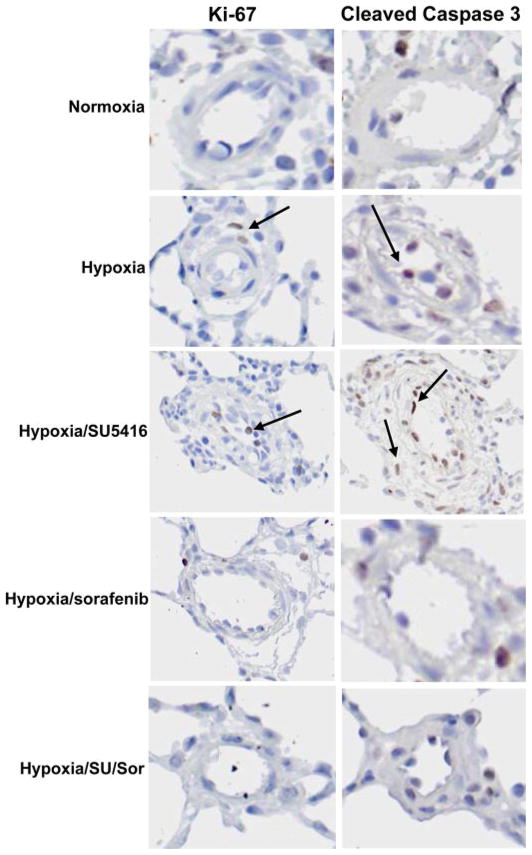
Fig. 6.
Effect of sorafenib on apoptosis and cellular proliferation detected by tissue microarray analysis. Representative images used for ACIS quantification of apoptosis and cell proliferation are shown for each condition. Interestingly, cleaved caspase-3 staining was primarily localized to the adventitia and the endothelium (arrows) in hypoxia/SU-5416 and hypoxia, while Ki-67 staining was prevalent in all vessel layers, as demonstrated by arrows in hypoxia- and hypoxia/SU-5416-based images.

