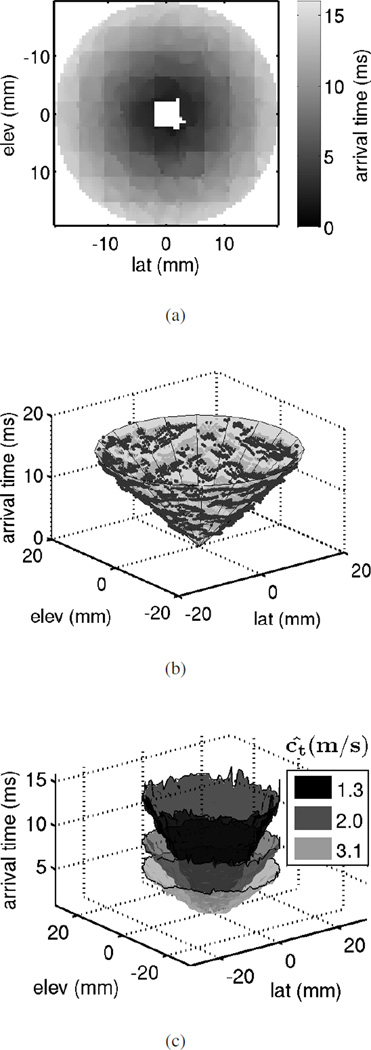
Fig. 4.
(a) Shear wave arrival times measured from the 4.8 kPa homogeneous phantom in the plane orthogonal to the push axis at an imaging depth of 60mm, which is near the excitation focal depth. The push is approximately at the center of the FOV. Arrival time measurements close to the push near the center of the FOV were not possible, as a result of reverberation echoes of the radiation force excitation. (b) Least squares cone-fit to the arrival times shown in (a). The actual push axis location and orientation, as well as the SWS can be estimated from the parameters of the cone. (c) Surface plots of arrival times at the same imaging depth (60mm) measured from three homogeneous phantoms of different stiffness. The estimated SWS from cone-fits to the data shown are displayed.

