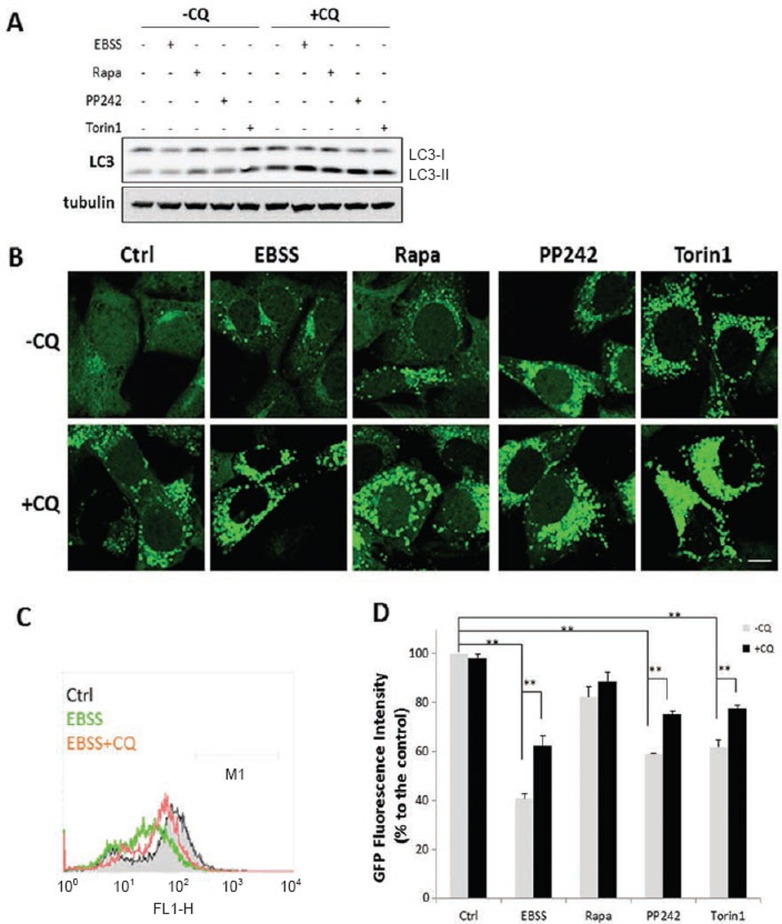
Figure 1.
Induction of autophagy by starvation and mTOR inhibitors in MEFs. (A) MEFs with stable expression of GFP-LC3 were treated with EBSS, rapamycin, PP242 or Torin1 (all at 1 μM) with or without CQ (50 μM) for 3 h. At the end of treatment, cell lysate was collected and subject to immunoblotting. (B) MEFs with stable expression of GFP-LC3 were treated as described in panel (A). Scale bar, 10 μm. (C and D) MEFs with stable expression of GFP-LC3 were treated as indicated in Panel (A), and total GFP intensity were measured by flow cytometry. Typical histograms were shown in panel (C) and the quantification data in panel (D). Data are presented as mean ± SD from two independent experiments (each in duplicate) (**P< 0.01, Student's t-test).

