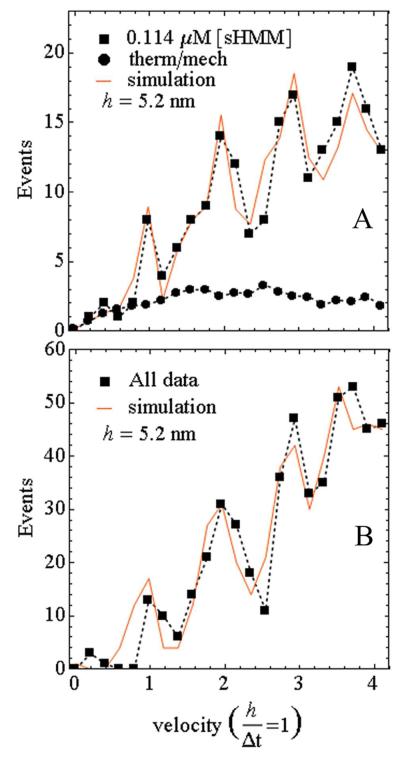
Figure 4.
Actin sliding velocity event distribution for 50 msec frame capture intervals. (A) Event distribution for the 0.114 μM bulk sHMM concentration (closed squares connected by dashed line) and the simulation (solid line). The fitted baseline representing thermal/mechanical velocity fluctuation (closed circles connected by dashed line) is also shown. (B) Same as in A except for the event distribution summed over all bulk concentrations. Simulated lines are generated as described in the text.

