
Figure 5.
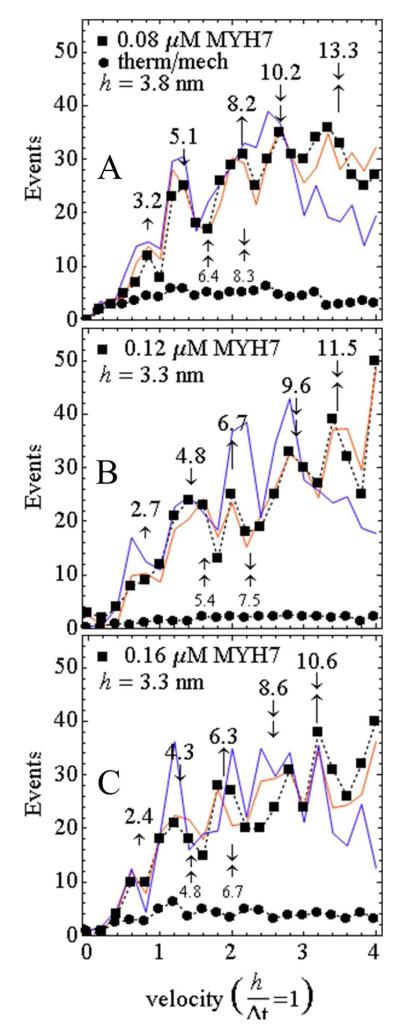
Actin sliding velocity event distribution for 200 msec frame capture intervals. Single vertical arrows identify unitary steps (↼ short, ⇑ medium, ⒑ long), and their correlation to peaks in the velocity histogram. Arrow orientation (up or down) is for clarity and has no significance. Combined vertical arrows indicate multiple unitary step combinations. Numbers above the vertical arrows indicate observed steps in nm computed by multiplying the ordinate position with the step parameter, h. Smaller font step lengths below the curves are two short or one short-one medium combinations that are often not evidentially present in the experimental data. (A) Event distribution for the 0.08 μM bulk MYH7 concentration (closed squares connected by dashed line) and simulations (solid lines). Simulations include 2 (blue) or 3 (red) unitary steps. Fitting parameter h = 3.8. The fitted baseline (closed circles connected by dashed line) represents thermal/mechanical velocity fluctuation. (B and C) Same as in A except for 0.12 and 0.16 μM bulk MYH7 concentration and fitting parameter h = 3.3.