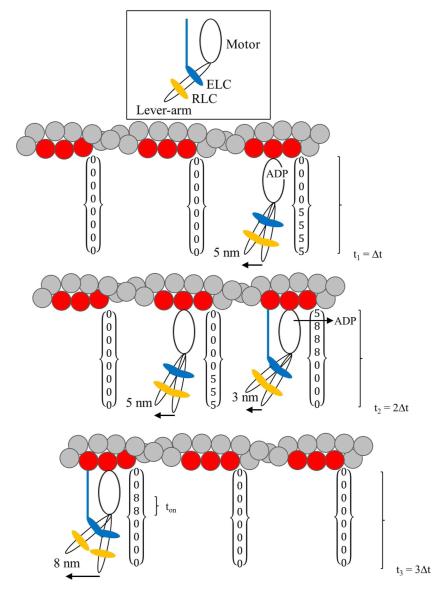
Figure 6.
The three steps of MYH7 and their representation in the time×space array used in the simulation. MYH7 cross-bridge has a motor domain, lever-arm, and two light chains ELC (blue) and RLC (orange) indicated at the top. The actin/ELC linkage, shown as a line connecting ELC with actin, modulates myosin step size. The 3 actin monomers in the target zone are shown in red. Each target zone has a column in the time×space array. The figure shows three frame capture intervals, Δt, with frame capture happening at t = t1, t2, and t3. The cross-bridge attached at the upper right performs the major 5 nm step giving the 5 nm displacement recorded at t1. Slow ADP release is indicated in the 5 nm step cycle shown. This cross-bridge remains attached into the second exposure interval when it releases ADP then converts to the 8 nm step with the ELC linkage and produces the minor 3 nm displacement. Additional displacement of 5 nm by the middle cross-bridge releases ADP without the ELC linkage in the second exposure interval giving 3+5 nm total displacement at t2 due to two different unitary steps. The third exposure interval has a unitary 8 nm displacement caused by a minor step from a single cross-bridge.

