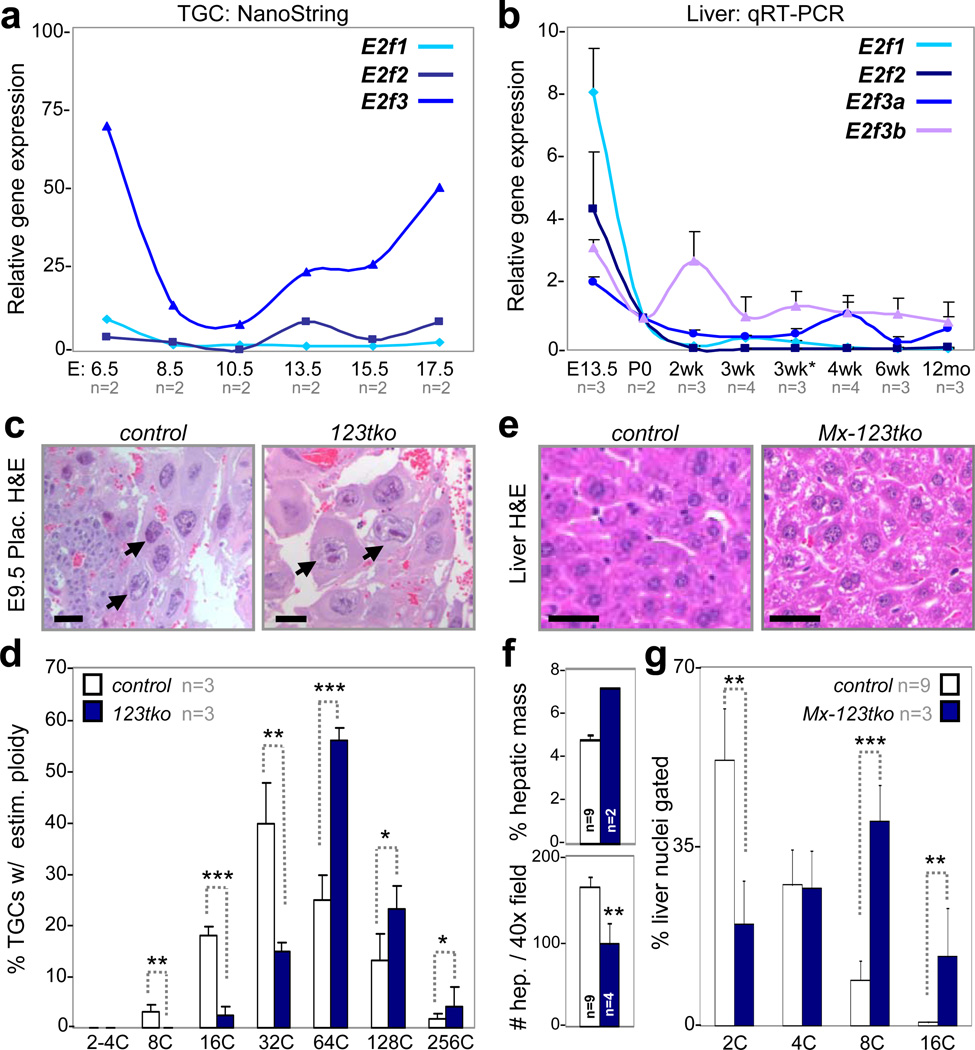
Figure 1. Loss of E2f activators promotes TGC and hepatocyte endocycles.
a, NanoString analysis of TGC-specific E2f1-3 expression in laser capture microdissected wild type cells, n=2 placentas analyzed per time point. b, Quantitative RT-PCR analysis of E2f activators in pre- (E13.5) and post-natal (P0-12mo) wild type livers, with n per time point as indicated. 3wk*, 1 day post weaning (3wk). c, Representative E9.5 H&E placenta sections showing control and E2f1−/−;E2f2−/−;E2f3−/− (123tko) TGCs. Arrows point to selected TGCs. Scale bar, 12.5µm. d, Feulgen quantification of ploidy in E9.5 control and 123tko TGCs, n=3 per genetic group. One-way ANOVA, * p≤0.05, ** p≤0.01, *** p≤0.001. e, Representative H&E sections showing control and Mx-cre;E2f1−/−;E2f2−/−;E2f3f/f (Mx-123tko) livers of 8-week-old mice 10 days after pIpC injection. Scale bar, 10µm. f, Measurements showing enlarged Mx-123tko livers (top graph) and hepatocytes (bottom graph) relative to control tissues and hepatocytes, with n per genetic group as indicated. Two-tailed Student T-test, ** p≤0.01. g, Flow cytometry of control and Mx-123tko liver nuclei from 8-week-old mice, with n per genetic group as indicated. One-way ANOVA, ** p≤0.01, *** p≤0.001. c control, wild type TGCs; e control, pIpC injected Mx-cre;E2f1−/−;E2f2−/−;E2f3+/+ livers; f-g control, wild type livers. Data in a, b, d, f and g reported as average values, ± SD are included when n>2 samples were analyzed.

