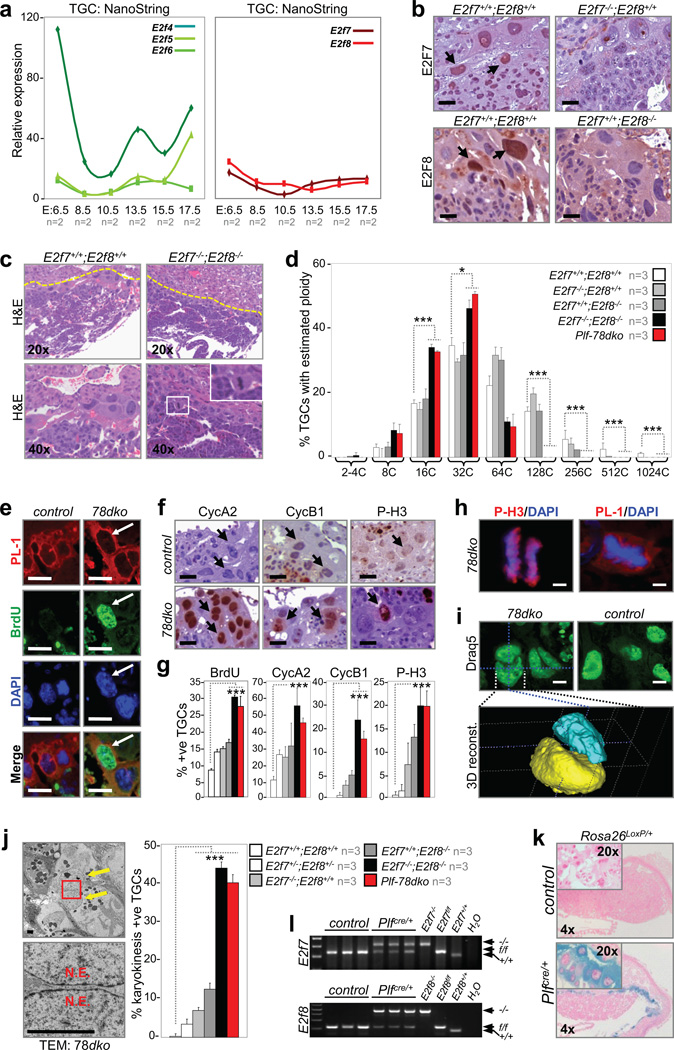
Figure 2. E2f7 and E2f8 promote TGC endocycles.
a, NanoString analysis of TGC-specific E2f4-6 (left panel) and E2f7/E2f8 (right panel) expression in laser capture microdissected wild type cells, n=2 placentas analyzed per time point. b, Immunohistochemistry demonstrating E2F7 (top left) and E2F8 (bottom left) expression in wild type E10.5 TGCs but not mutant controls. Arrows point to selected TGCs. Scale bar, 10µm. c, Representative H&E sections of E10.5 control and E2f7−/−;E2f8−/− (78dko) placentas. Inset, a 78dko TGC in metaphase. d, Feulgen quantification of genome ploidy in E10.5 TGCs, n=3 placentas analyzed per genetic group. e–g, Immunostaining and quantification of S and M phase proteins in E10.5 control and 78dko TGCs. Arrows point to TGCs. n=3 placentas analyzed per genetic group. Scale bar in e–f, 12.5µm. h, Co-immunofluorescence showing E10.5 78dko TGCs in anaphase (left, P-H3) and metaphase (right, PL-1). DAPI stained total DNA. Scale bar, 5µm. i, Representative confocal images of nuclei in E10.5 control and 78dko TGCs (top) and 3D reconstruction of a binucleated 78dko TGC (bottom). Draq5 stained total DNA pseudocolored in green. Scale bar, 10µm. j, Left, transmission electron micrograph of a 78dko E10.5 TGC (left top, arrows indicate two nuclei; left bottom, enlarged view of boxed area showing separation between nuclear envelopes). Right, quantification of binucleated E10.5 TGCs, n=3 placentas analyzed per genetic group. k, X-gal staining of E10.5 control and Plfcre/+ placentas carrying the reporter allele Rosa26LoxP. l, PCR genotyping of genomic DNA isolated from laser capture microdissected E10.5 control and Plfcre/+ TGCs. e, f and i control, E2f7+/+;E2f8+/+; e, f and h–j 78dko, E2f7−/−;E2f8−/−; k control, Plf+/+;Rosa26LoxP/+; l control, Plf+/+;E2f7f/f;E2f8f/f; d, g, and j Plf-78dko, Plfcre/+;E2f7f/f;E2f8f/f. PL-1, placental lactogen 1; N.E., nuclear envelope. Data in a, d, g and j reported as average values, ± SD are included when n>2 samples were analyzed. One-way ANOVA, * p≤0.05; ** p≤0.01; ***p≤0.001.

