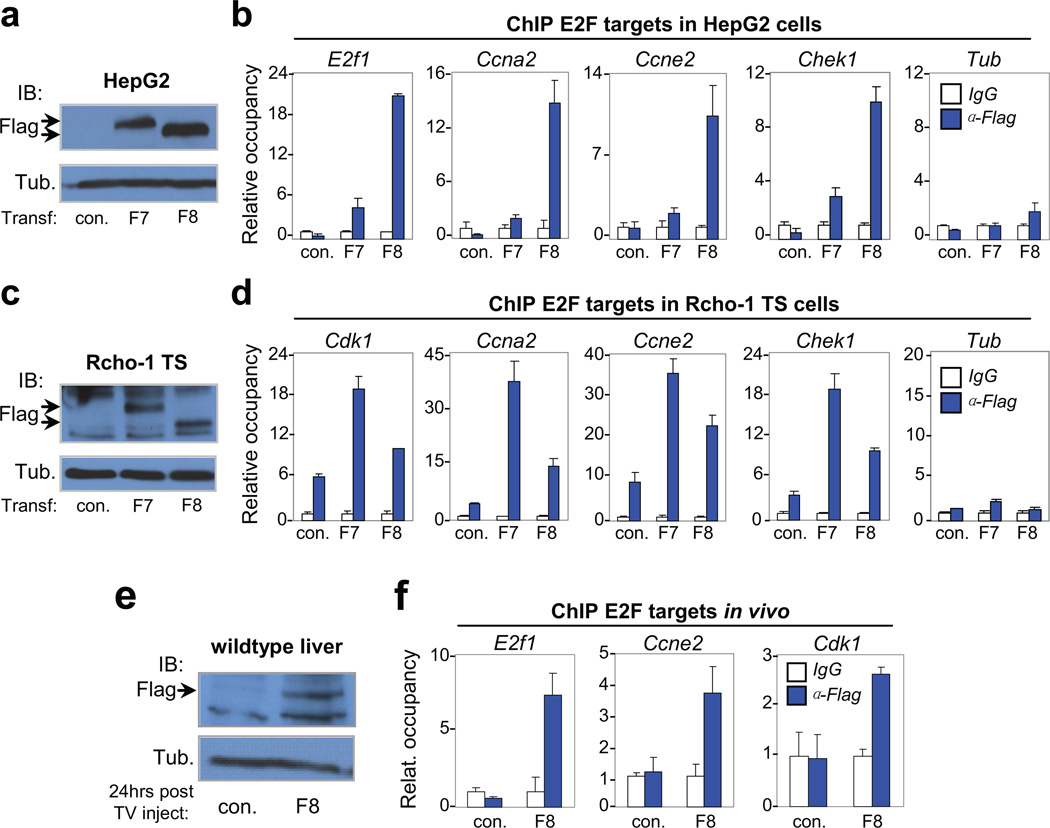
Figure 5. Atypical repressors E2F7/E2F8 directly bind gene targets involved in endocycle control.
a, Immunoblot of transfected HepG2 cells showing exogenous expression of flag-tagged E2F7 (F7) and E2F8 (F8) proteins with Tubulin as control. Arrows indicate tagged protein. b, Representative chromatin immunoprecipitation (ChIP) assay in transfected HepG2 cells with anti-Flag antibodies demonstrating enhanced occupancy of F7 and F8 proteins on E2F binding sites in the promoter of G1/S (E2f1 and Ccne2) and G2/M (Ccna2 and Chek1) genes. The Tubulin (Tub) gene, a non-E2F target, demonstrates specific recruitment of F7/F8 to target promoters containing consensus E2F binding sequences. n=3 independent transfection-ChIP experiments performed. c, Immunoblot of transfected Rcho-1 TS cells showing exogenous expression of F7 and F8 proteins with Tubulin as control. Arrows indicate tagged protein. d, Representative ChIP assays in transfected Rcho-1 TS cells of G1/S and G2/M genes as in HepG2 cells. n=3 independent transfection-ChIP experiments performed. e, Immunoblot of liver lysates from 6-week-old mice demonstrating expression of tagged E2F8 protein. A total of 10µg of plasmid DNA was delivered through tail vein injection. Lysates were prepared from livers 24 hours after injection. Tubulin served as loading control. n=3 and n=5 wild type mice were injected with control (empty) plasmid and plasmid expressing Flag-E2F8, respectively. One out of 5 had detectable expression of F8 as shown by Western blot (Fig. 5e). f, ChIP assay in liver lysates with anti-Flag antibodies demonstrating enhanced occupancy of F8 on E2F binding sites in the promoter of G1/S (E2f1 and Ccne2) and G2/M (Cdk1) genes. a–f con., empty plasmid; F7, plasmid expressing flag-tagged E2F7; F8, plasmid expressing flag-tagged E2F8. Data in b, d and f from the representative experiment are reported as average values from triplicate quantitative RT-PCR reactions ± SD.

