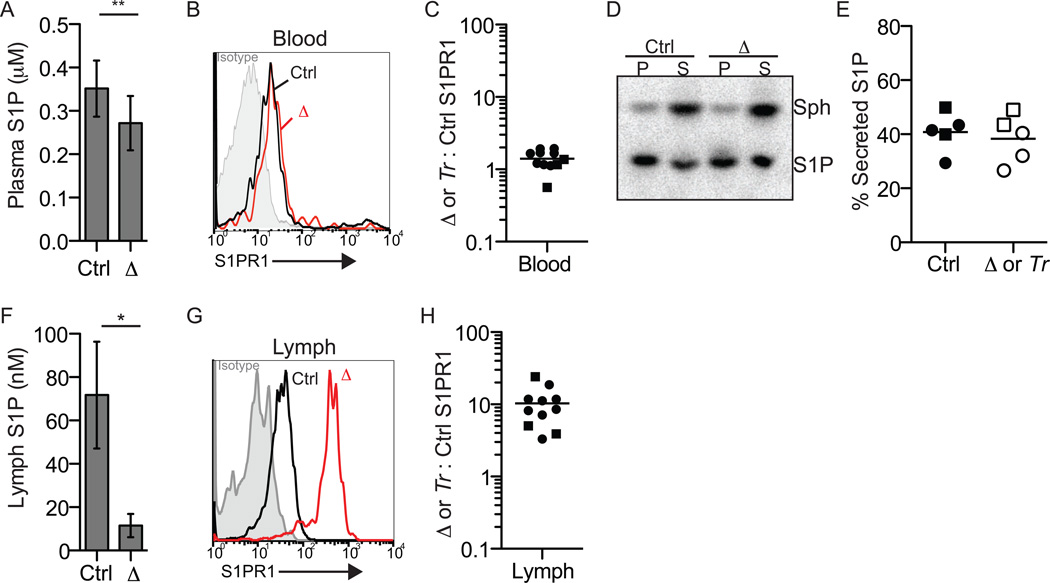
Figure 2. Spns2 is essential to supply lymph S1P, but makes a minor contribution to plasma S1P.
(A-E) Spns2 makes a minor contribution to plasma S1P.
(A) Plasma S1P of Spns2f/fTie2-Cre+ (Δ) and littermate control mice quantified by mass spectrometry (n=6, error bars show standard deviation). (B) Surface S1PR1 on CD62LhiCD4+T cells circulating in the blood of a representative Spns2f/fTie2-Cre+ mouse (red) and its littermate control (black). Isotype control is shaded grey; note that based on staining of S1PR1 knockout animals, the isotype control staining may be artificially low (Green et al. 2011 and data not shown). (C) The ratio of surface S1PR1 MFI on CD62LhiCD4+T cells in the blood of a Spns2f/fTie2-Cre+ or Spns2tr/tr (Tr) mouse to surface S1PR1 MFI on CD62LhiCD4+ T cells in the blood of its littermate control. Circles indicate Spns2f/fTie2-Cre+ mice and controls (8 pairs analyzed in 7 experiments), and squares indicate Spns2tr/tr mice and controls (3 pairs analyzed in 3 experiments). (D-E) Spns2f/fTie2-Cre+ or Spns2tr/tr and littermate control RBC were incubated with [3-3H]sphingosine (Sph), which crosses the plasma membrane into the cytosol where it can be phosphorylated. After 90 minutes, the cell pellet (P) and supernatant (S) were collected. Extracted lipids were separated by thin layer chromatography (TLC) to assess the distribution of [3-3H]S1P. (D) A representative TLC plate visualized by Phosphorimager. (E) Data pooled from 5 experiments. % secreted S1P: 100×[S1P in supernatant]/[S1P in pellet + S1P in supernatant]. Circles indicate Spns2f/fTie2-Cre+ mice and controls, and squares indicate Spns2tr/tr mice and controls.
(F-H) Spns2 is essential to supply lymph S1P.
(F) Lymph S1P of Spns2f/fTie2-Cre+ mice and littermate controls quantified by mass spectrometry (n=2-3, error bars show standard deviation). (G) Surface S1PR1 on CD62LhiCD4+ T cells circulating in the lymph of a representative Spns2f/fTie2-Cre+ mouse (red) and its littermate control (black). Isotype control is shaded grey. (H) The ratio of surface S1PR1 MFI on CD62LhiCD4+ T cells in the lymph of a Spns2f/fTie2-Cre+ or Spns2tr/tr (Tr) mouse to surface S1PR1 MFI on CD62LhiCD4+ T cells in the lymph of its littermate control. Circles indicate Spns2f/fTie2-Cre+ mice and controls (8 pairs analyzed in 7 experiments), and squares indicate Spns2tr/tr mice and controls (3 pairs analyzed in 3 experiments). *p<0.05, **p<0.01

