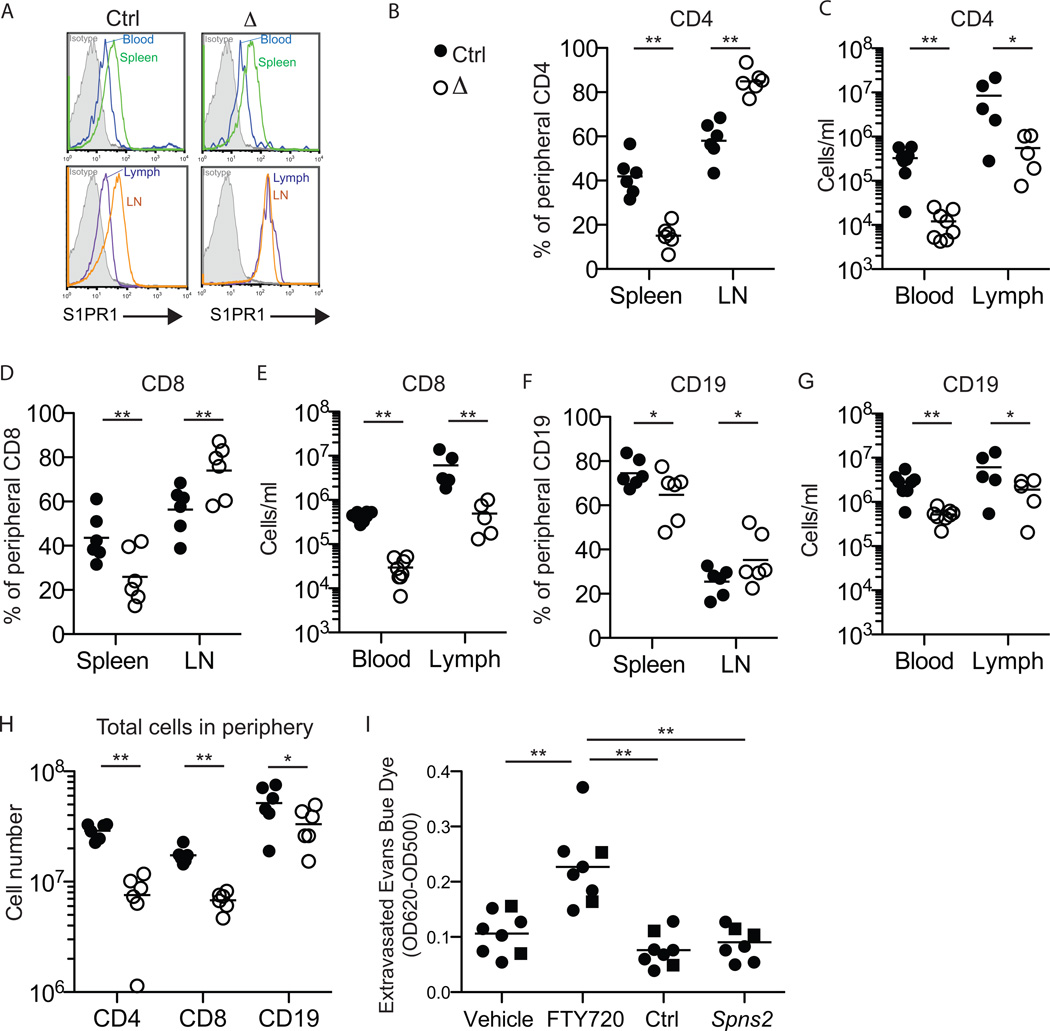
Figure 3. Spns2 is required for peripheral lymphocyte circulation.
(A) Surface S1PR1 on CD62LhiCD4+ T cells in the blood and spleen (top panels) and in the lymph and lymph nodes (bottom panels) of a representative Spns2f/fTie2Cre+ mouse (Δ) and its littermate control (Ctrl). Isotype control is shaded grey. Data are representative of 8 pairs of mice analyzed in 7 experiments.
(B-G) Lymphocyte distribution in Spns2f/fTie2Cre+ mice and littermate controls.
(B,D,F) Percent of total peripheral CD62LhiCD4+ T cells (B), CD62LhiCD8+ T cells (D), and CD62LhiCD19+ B cells (F) in the spleen and lymph nodes (LN). Total peripheral lymphocytes are defined as those in spleen and a subset of LN (brachial, axillary, inguinal, and mesenteric); blood and lymph make a negligible contribution. [For example, (B, spleen) shows 100×(# CD62LhiCD4+ T cells in spleen)/(# CD62LhiCD4+ T cells in spleen + # CD62LhiCD4+ T cells in LN).] Data pool 6 pairs of mice analyzed in 5 experiments. (C,E,G) Total number of CD62LhiCD4+ T cells (C), CD62LhiCD8+ T cells (E), and CD62LhiCD19+ B cells (G) in blood and lymph. Data pool 8 pairs of mice analyzed in 7 experiments for blood, and 5 pairs of mice analyzed in 4 experiments for lymph. (H) Total number of CD62LhiCD4+ T cells, CD62LhiCD8+ T cells, and CD62LhiCD19+ B cells in the periphery. Data pool 6 pairs of mice analyzed in 5 experiments.
(I) Vascular permeability in Spns2f/fTie2Cre+ mice and littermate controls.
Spns2-deficient mice and littermate controls, and C57BL6 mice treated with FTY720 or vehicle, were injected intravenously with Evans Blue dye. After 90 minutes, mice were perfused with PBS. Lungs were removed and extravasated Evans Blue dye was quantified by spectrophotometry. Circles indicate Spns2f/fTie2-Cre+ mice and controls (6 groups analyzed in 6 experiments), and squares indicate Spns2tr/tr mice and controls (2 groups analyzed in 2 experiments).
*p<0.05, **p<0.01. See also Fig. S2.

